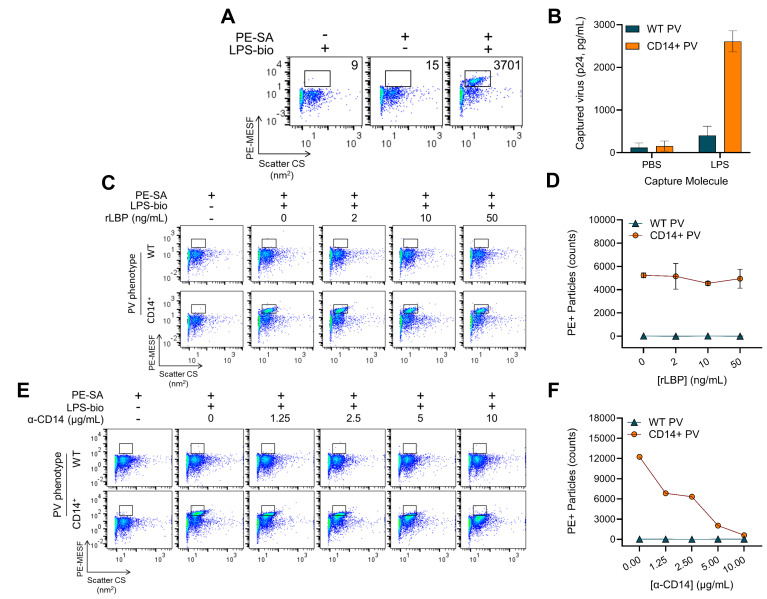
Fig 4.
LPS binds to HIV-1 in a CD14-specific manner and does not passively associate with the lipid envelope. (A) Optimized LPS-bio (300 ng/mL, overnight, 4°C) and PE-SA (0.2 µg/mL, 4 h, 4°C) staining on CD14+ virions. Particle counts in PE+ gates are enumerated on each plot. (B) Virion capture assay using immobilized untagged LPS. Ninety-six-well plates were coated with buffer (PBS) or LPS and virions with (CD14+, orange bars) or without CD14 (WT, teal bars) were added. Captured virions were quantified by Gagp24 ELISA. Bars are mean ± SD of duplicate capture assays and are representative of three independent experiments. (C) FVM evaluating the contribution of recombinant LPS-binding protein (LBP) on LPS-bio binding to CD14+ virions. Varying amounts of recombinant LBP (rLBP) were mixed with LPS-bio prior to incubating with WT (top row) and CD14+ (bottom row) virus samples and staining with PE-SA. Gates define PE+ events based on negative control (PE-SA only). WT and CD14+ virus stocks shown in FVM plots for (A) and (C) had a respective titer of 76 and 57 ng/mL p24 as measured by ELISA. (D) Particle counts in PE+ gates from (C) were plotted as a function of PE-SA concentrations for WT (teal triangles) and CD14+ virions (orange circles). Data are mean ± SD of two independent virus stocks. (E) FVM measuring neutralization of LPS-bio binding to virions. Anti-CD14 (M5E2) was added to WT (top row) and CD14+ (bottom row) virions before incubation with LPS-bio and PE-SA. Gates are as described for (C). WT and CD14+ virus stocks shown in FVM plots had a respective titer of 368 and 141 ng/mL p24 as measured by ELISA. (F) Particle counts in PE+ gates from (E) were plotted over the range of anti-CD14 concentrations tested for WT (teal triangles) and CD14+ (orange circles) virions. Data are representative of two independent virus stocks.

