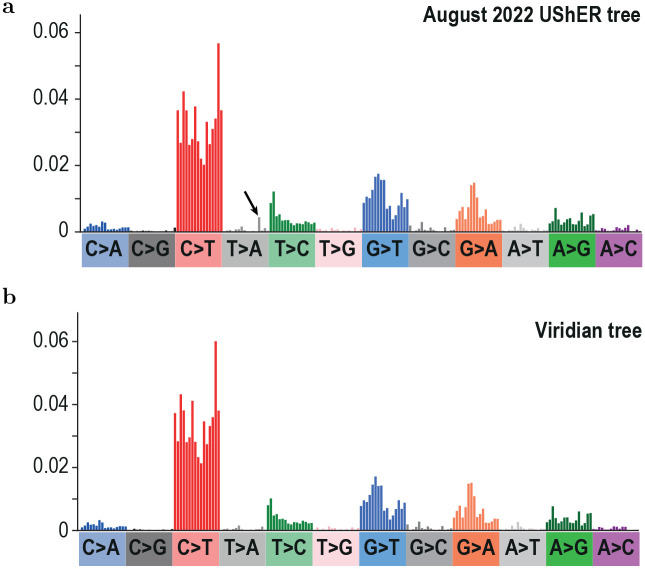
Figure 6:
Comparison of Alpha variant mutational spectra calculated using (a) the August 2022 UShER tree [26] and (b) the Viridian tree. Colours show different mutation types (for example C mutating to T, labelled as C>T) and bars show individual surrounding contexts (for example an upstream A and a downstream A). Spectra are rescaled by the availability of the starting nucleotide triplet. The arrow shows a contextual mutation that is unexpectedly elevated in the August 2022 UShER tree; this elevation is not present in the Viridian tree.

