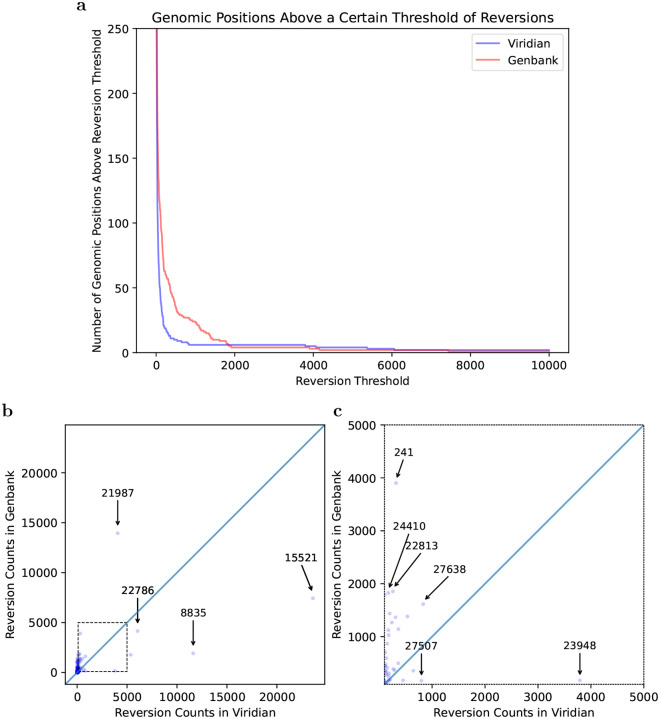
Figure 4: Most variable sites cause fewer reversions in the Viridian tree than the GenBank tree.
a) Plot showing how many positions in the genome (y axis) have at least N reversions (x axis) in each tree (Viridian in blue, GenBank in red). Viridian curve drops faster, having fewer positions that create many reversions. b) Scatterplot comparing count of reversion mutations found in GenBank Dataset (y axis) and Viridian dataset (x axis). Note (0,0) is slightly indented from the origin of the plot. Each point represents a position of the SARS-CoV-2 genome. Three points below the line y=x are highlighted (labelled by genomic coordinates: 22786, 8835, 15521) where Viridian has particularly high numbers of reversions, and one (labelled 21987) for GenBank. c) Blow up of dotted square from panel b) showing vast majority of variable sites in the genome lie above the line y=x.

