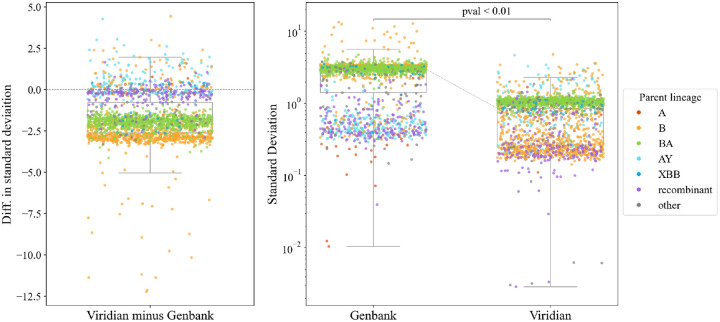
Figure 5: Comparison of uncertainty in growth estimates for different lineages when based on either the Viridian or Genbank tree.
Panels a) (left) and b) (right) plot the same data in two ways; each point represents one lineage. Panel a) plots the difference in standard deviation of posterior density of relative growth rate estimate ΔlogR (i.e. standard deviation using the Viridian tree minus standard deviation using the Genbank tree). Negative values here show that on average, the Viridian tree yields lower uncertainty than the Genbank tree. Panel b) shows the standard deviation of the posterior density of relative growth rate estimate ΔlogR based on the GenBank tree (left) and Viridian tree (right). The median standard deviation of strain growth rate using the Genbank tree is 2.967, while the median standard deviation using the Viridian tree is 0.859. This difference is statistically significant (p < 0.01, paired t-test). Box-plots show first and third quartiles (lower and upper boundaries of box), and whiskers are set to the farthest point that is within 1.5 times the inter-quartile range from the box. Legend labels denote parent lineage.

