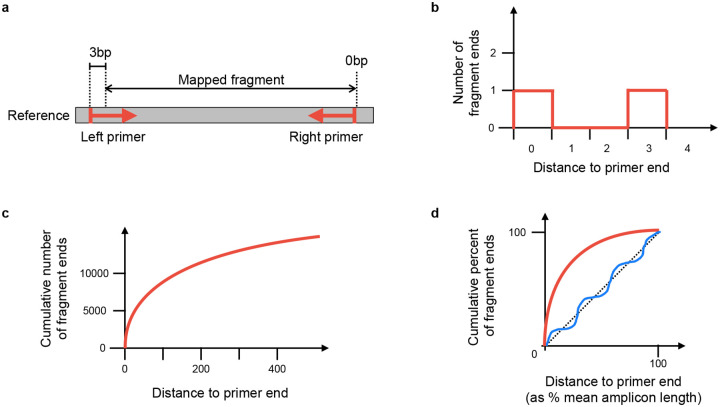
Figure 7:
Method to score an amplicon scheme, using mapped fragments. a) Example of one mapped fragment, where its left end is 3bp from the start of the primer, and its right end is 0bp from the end of the right primer. b) The plot generated from the fragment in a). The right end of the fragment increments the counter for zero distance from a primer, and the left end of the fragment increments the counter for 3bp distance from a primer. The information from all fragments in the sample is added in this way, to make the distribution of distances from nearest primer ends. c) The cumulative plot from b) after adding all fragments. d) Plot c) is normalised by taking distance to primer end as a percentage of the mean amplicon length (x axis), and fragment counts as percent of total fragments (y axis). The red line indicates a typical curve where the reads match the scheme, whereas the blue line shows a scheme that does not match. The scheme’s score is the sum of differences between the calculated line and the y = x line (shown as a dashed line).

