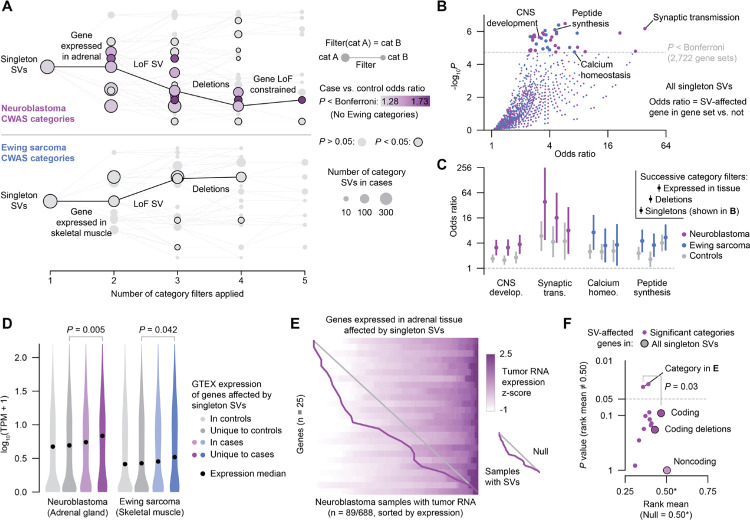
Fig. 4 |. Ultra-rare germline SVs in pediatric cancer patients dysregulate gene expression in premalignant tissues and in tumors.
(A) Diagrams of CWAS category relationships. Singleton SV categories are depicted as nodes and filters as edges. The x-axis represents the number of filters applied to each category, while the vertical space between categories is proportional to their similarity (Jaccard index). Example filter paths containing at least nominally significant categories are shown in black. (B) Gene set enrichment results for risk-carrying singleton SVs and GO biological processes. Odds ratios were computed by a Fisher’s exact test of an SV-affected gene being in the category and also in the gene set. (C) Gene set enrichment results for select gene sets and categories in cases and controls. The three categories shown for each gene set represent singleton SVs, singleton deletions, and singleton deletions affecting genes expressed in the tissue-of-origin (i.e., successively applied filters). Bars represent 95% CI. (D) Expression in GTEx v8 for genes affected by singleton SVs in controls, unique to controls, in cases, and unique to cases.39 P values from Wilcoxon test. (E) Expression heatmap of genes expressed in adrenal tissue that were affected by singleton SVs in the subset of neuroblastoma patients with tumor RNA data available. Each row represents a gene and each column represents a sample; samples within each row are ordered by expression z-score. Samples with SVs (one per row) are connected by a purple line. Diagonal gray line indicates expectation under a uniform null. (F) Effect on tumor expression of SVs in significant neuroblastoma categories. Y-axis represents the P value of comparing to the null uniform distribution (i.e., no effect on expression). Larger points represent higher-level groupings of SVs. Indicated P value is from bootstrap-comparing the category from (E) to the background of all coding SVs.

