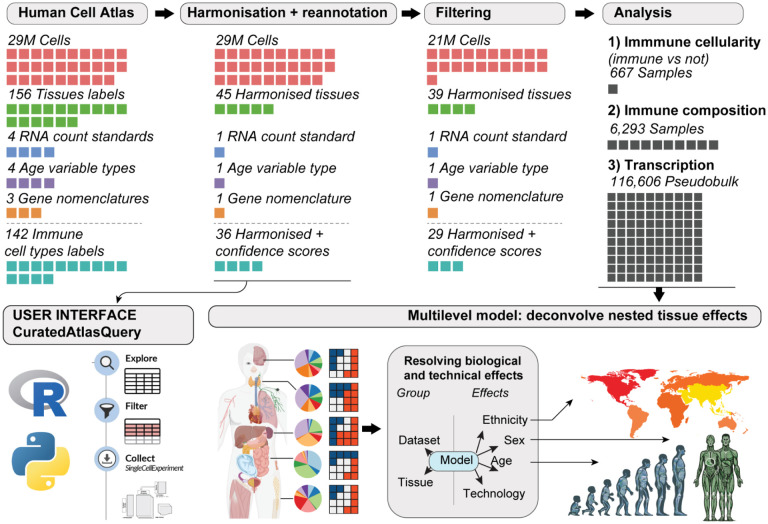
Figure 1. Overview of the study.
Each coloured cell represents a quantity specified in its headers. From left to right: We retrieved Human Cell Atlas data through the CELLxGENE repository. We harmonised cell metadata, gene nomenclature, and count distributions and scored cell annotations for quality using an ensemble approach of several annotation references. We provide this resource to the community through the CuratedAtlasQuery interface. To improve analysis robustness, we filtered cells based on annotation quality and data abundance (e.g. excluding samples with less than 30 cells and studies with less than three samples). We analysed the association of immune cellularity (proportion of immune vs non-immune cells), composition and transcription with age, sex, and ethnicity (i.e. nine total analyses).

