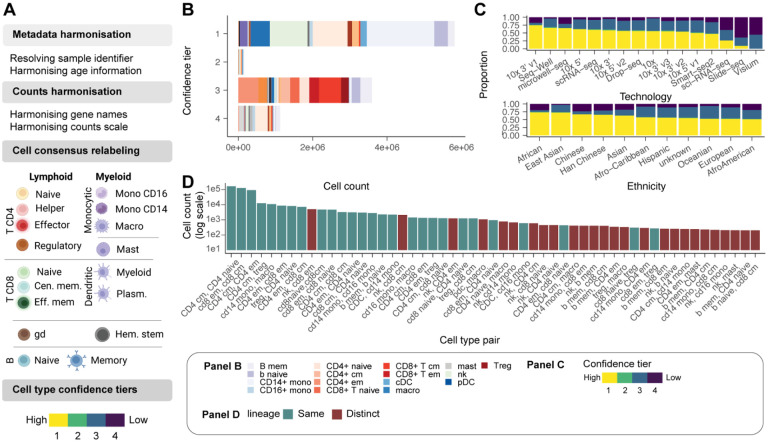
Figure 2. Data curation and query interface.
A: Schematic of the curation pipeline. B: Number of immune cells in each confidence tier. C: Proportion of cells in each confidence tier across technologies and ethnicity. D: Co-occurrence of cell type annotations (between methods) for cells in confidence tiers 2–4. For example, Azimuth may annotate a cell as a CD4 T cell, while SingleR with Monaco reference may annotate it as a CD8 T cell.

