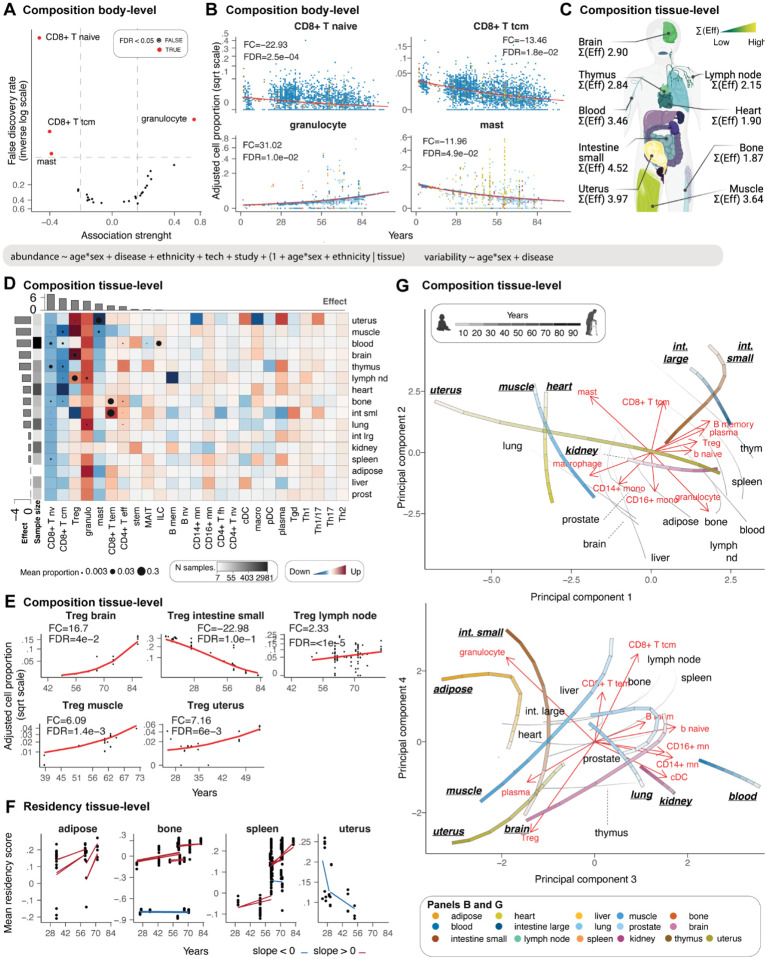
Figure 4. The landscape of immunity changes with age.
A: Enriched and depleted cell types through age. B: Association between immune composition and age across tissues. Only cell types with significant associations (false-discovery rate < 0.05) are displayed. Points represent samples. The signed fold change represents the ratio between the estimated proportion of the age range limits present in the data (e.g. 39–73 for muscle). C: Average (across cell types) immune compositional changes associated with age for each tissue. “Eff” is the effect, represented by the coefficient of the slope. Yellow represents large compositional changes. Significant associations are labelled as text. D: Detailed view of age-related immune compositional changes for each cell type and tissue. The red colours of the heatmap represent a positive association. Cell types and tissues/tissue are colour-labelled as previously described. Histograms represent the magnitude of composition changes (sum of absolute significant effects) across tissue for rows and cell types for columns. E: Age-trends of Treg composition for several tissues, referring to Panel D. The signed fold change is explained for Panel B. F: Association between residency score of T cells and age. Red and blue represent positive and negative associations, respectively. Trend lines are shown across datasets. G: Principal Component Analysis, capturing the most significant variances in immune cell composition with age. The trajectories, represented by the colour-matched lines, indicate the direction and magnitude of changes in immune composition within each tissue over time, at ages 20, 40, 60, and 80 years, as denoted by the increasing intensity of the grey scale. The red text and arrows, termed ‘loadings’ in PCA, suggest the relative contribution of different immune cell types to the ageing trajectories within each tissue. The longer the arrow, the more that immune cell type contributes to the variance in the dataset along that principal component. We display the top ten.

