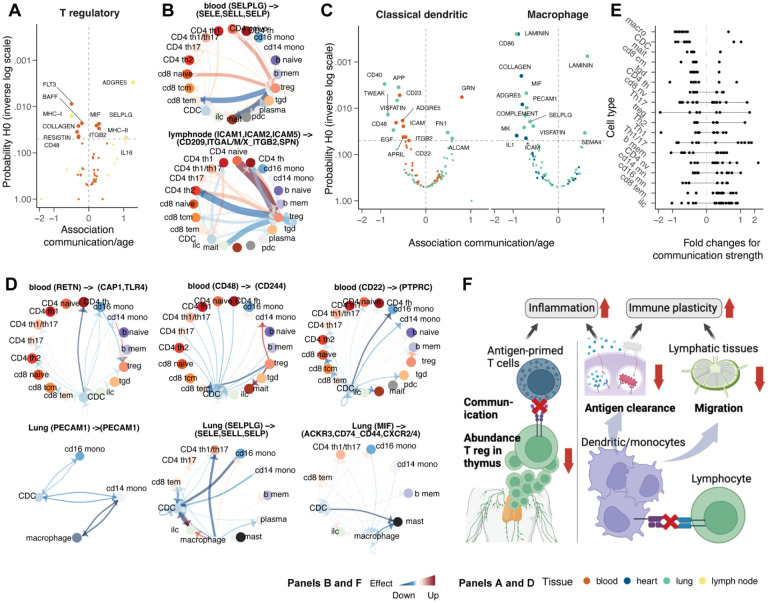
Figure 5. Changes in cell-cell communication with age.
A: Association between communication axes (which underlie several ligand and receptor genes) transcription abundance and ageing for T regulatory cells. B: Estimated changes in communication strength across cell types through ageing, mainly in T regs. Red and blue represent increase and decrease, respectively. C: Association between communication axes transcription abundance and ageing for classical (myeloid) dendritic cells and macrophages. D: Estimated changes in communication strength across cell types through ageing, mainly in professional antigen-presenting cells. Red and blue represent increase and decrease, respectively. E: Overall communication changes across cell types. Dots represent communication axes. Lines represent the 95% credible interval. F: Cartoon of the major mechanisms of inflammaging and losing immune adaptability to new infections through ageing.

