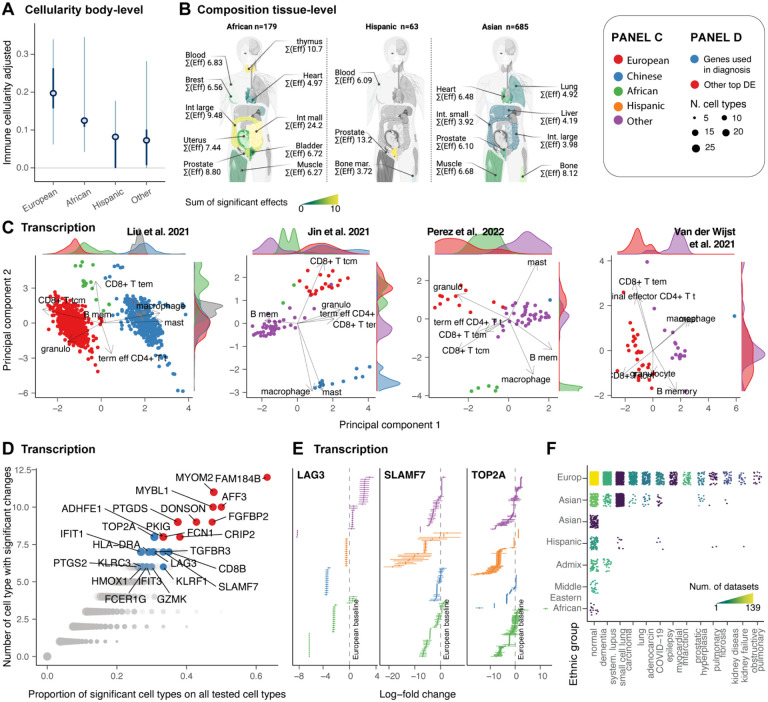
Figure 8. Changes in immune cell composition with sex and ethnicity.
A: Overall effect of sex on immune cellularity and its variability with females as the baseline. The mean, 50% and 95% credible intervals are visualised. B: Tissue-specific differences of immune cellularity between sexes. Left: cartoon of the human body coloured by significant effect. Right: Immune cellularity of samples, with non-sex effects removed. C: Sample distribution along reduced dimensions (principal components) coloured by ethnicity. D: Gene transcripts differentially abundant between Europeans (baseline because highly represented) and other ethnicities across several tissues and cell types. E: Credible intervals of selected top targets among the differentially abundant gene transcripts. F: Representation of the sample size for ethnicity across diseases. Dots represent samples. Quadrants are coloured according to the number of datasets.

