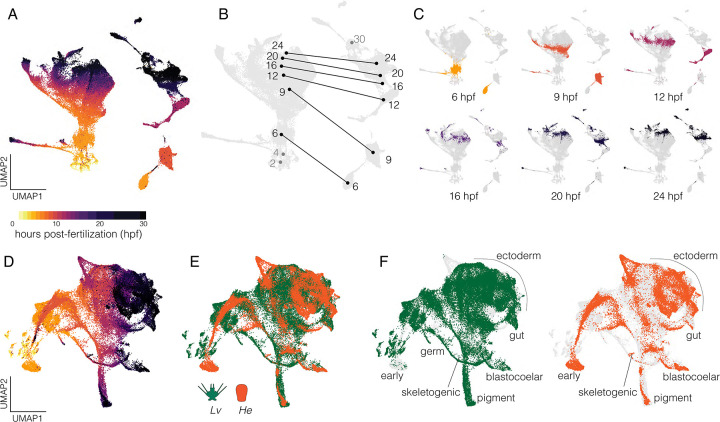
Figure 2. Combined single-cell transcriptomes.
A. UMAP of combined data from all gene models from both species without integration and cells colored according to developmental stage. The mass on the left is composed exclusively of cells from Lv while the more fragmented clumps on the right are composed exclusively of cells from He. B. Same plot, showing centroids of cells across developmental stages with lines connecting the same time points between species. Numbers correspond to hours post-fertilization (hpf); grey numbers refer to stages sampled in one species only. C. Individual UMAPs of shared time points with cells colored according to stage (same encoding as panel A). D. UMAP of integrated data from both species incorporating gene models of 1:1 orthologues only. Cells colored by stage (same encoding as panel A). E. Same plot with cells colored by species. F. Same plot as panel E with each species shown separately and cell identities labeled; light gray cells are from the complementary species.

