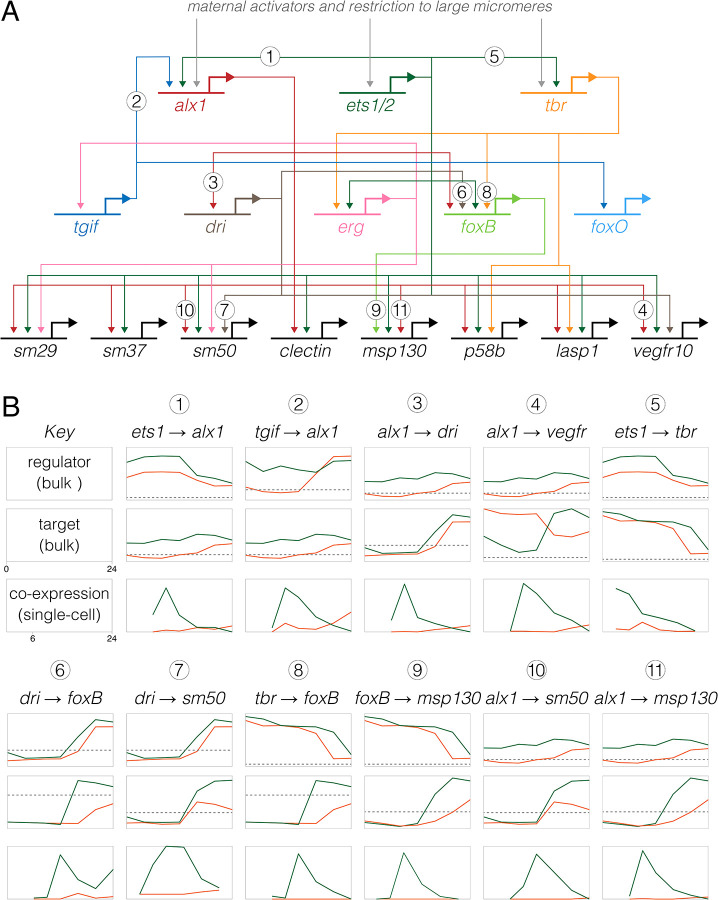
Figure 6. Inference of evolutionary changes in regulatory interactions based on proportion of co-expressing cells.
A. Simplified version of the skeletogenic portion of the ancestral dGRN present in camarodont sea urchins with feeding larvae (based on Kurokawa et al. 1999; Oliveri et al. 2002, Ettensohn et al. 2003; Oliveri et al. 2008; Rafiq 2012; Rafiq 2014). The three primary activators of skeletogenic-specific transcription (top) feed directly or indirectly into a large set of effector genes, some of which are illustrated (bottom). B. Co-expression analysis of 11 experimentally validated regulatory interactions, where Lv = green lines and He = orange lines. Numbers correspond to interactions in panel A) The top two plots for each interaction show expression of regulator and target based on bulk RNAseq (Israel et al., 2016), with a log2 y-axis and the dashed line indicating very low expression (an average of 5 counts per million reads across time points). The plot directly below shows the proportion of cells that co-express both genes based on scRNA-seq, with a linear y-axis; these time-points begin a 6 hpf, the first time point common to both data sets. Note that y-axes are not equivalently scaled because genes have a wide range of expression and co-expression levels. Most gene pairs show a strong peak of co-expression at 9 hpf in Lv, which then drops as skeletogenic cells stop dividing while other cell lineages continue to proliferate. In contrast, this peak is notably absent in He; instead, co-expression is initially zero or very low at 9 hpf and rises modestly 16–24 hpf.

