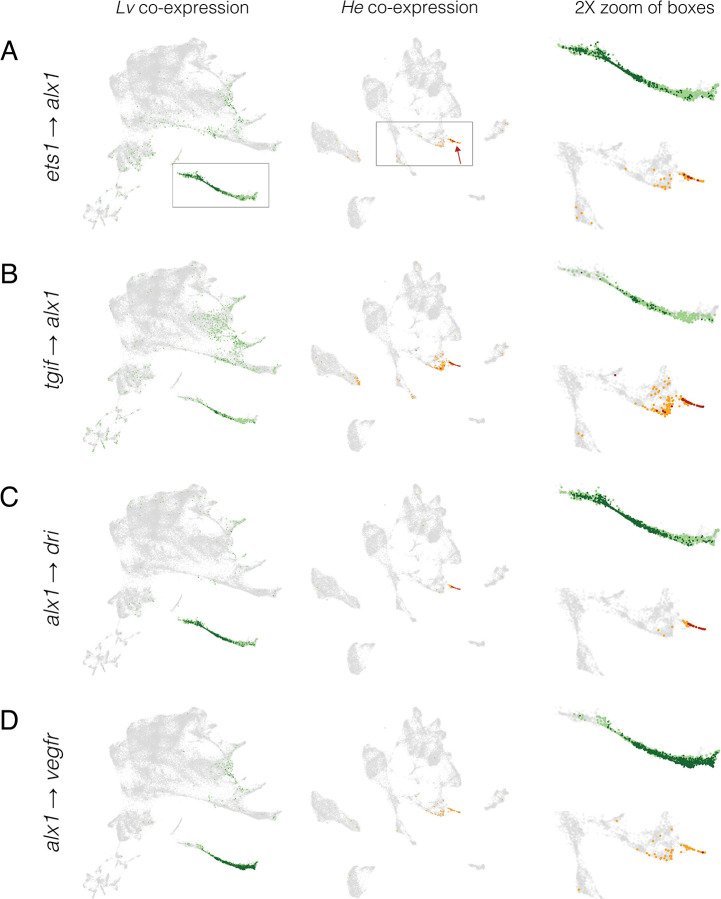
Figure 7. Inference of evolution changes in regulatory interactions based on distribution of co-expressing cells.
Co-expression analysis of experimentally validated regulatory interactions. UMAPs show the location of cells with co-expression of indicated regulator and target. Lv = green dots and He = orange dots; dark colors indicate cells with >2 UMIs for both regulator and target gene; pale colors indicate low co-expressing cells, where one or both genes have 1 or 2 UMIs. Boxes indicate areas shown at 2X in the right-hand column and arrows indicate skeletogenic cells.

