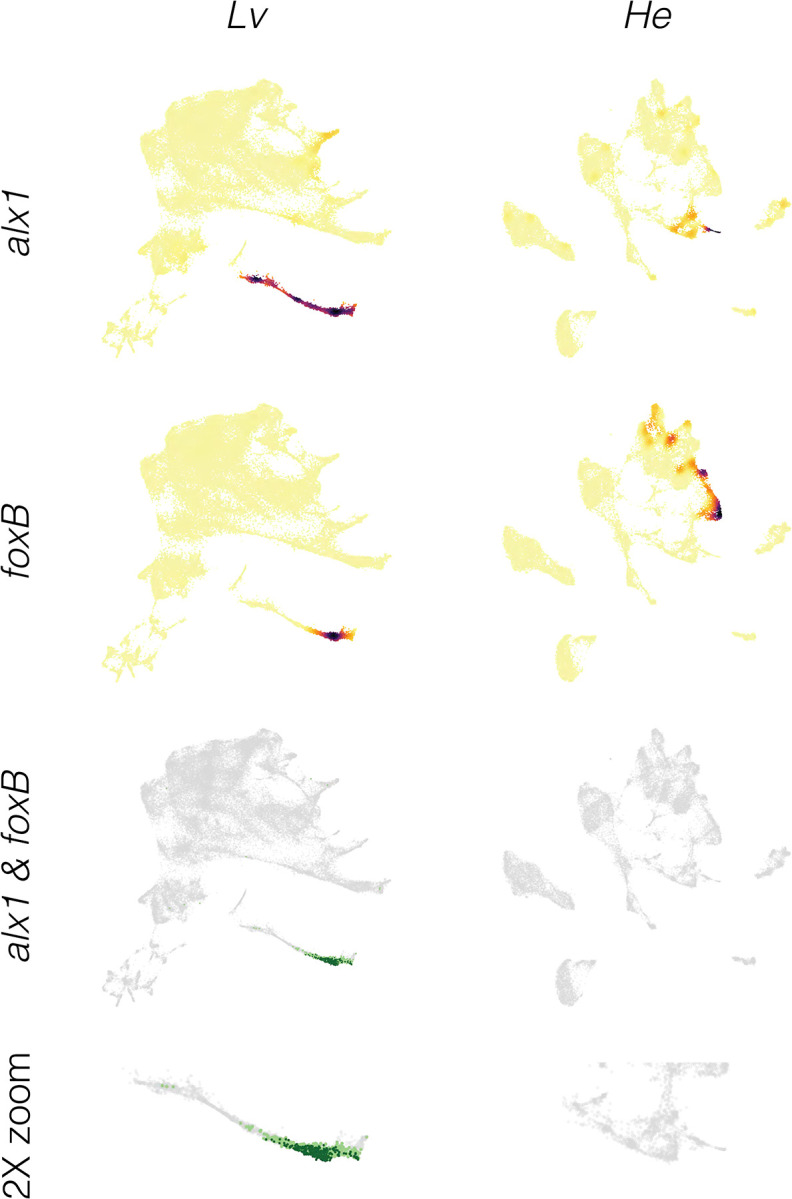
Figure 8. Inference of evolutionary loss of a regulatory interaction.

A. Density plots showing expression of regulator (alx1) and target (foxB) genes in both species. Note that both alx1 and foxB transcripts are readily detected in both species. B. Co-expression plots. The complete absence of co-expression in He suggests that the ancestral alx1 → foxB regulatory interaction has been lost in this species.
