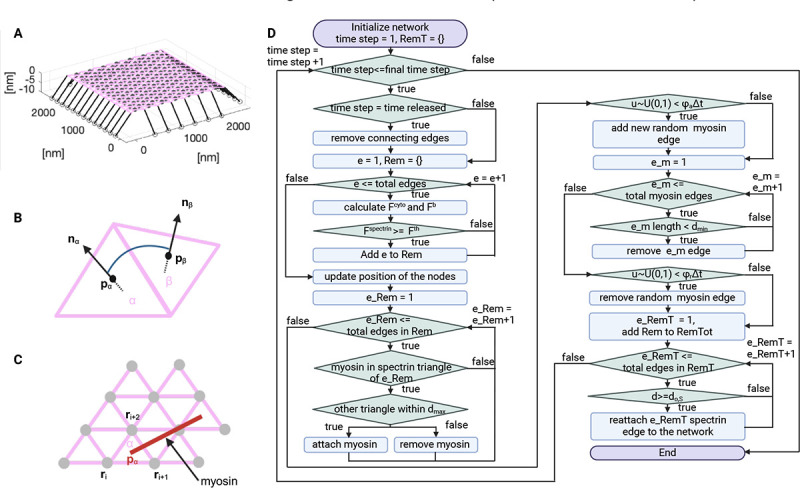
Figure 2: Actin-spectrin meshwork simulation.

A) 3D view of the initial configuration of the mesh. Pink and black lines correspond to spectrin and connector edges, respectively. Grey filled circles are F-actin nodes and black empty circles represent focal adhesions. B) Schematic representation of the angle formed by the and triangular faces of the meshwork. C) Myosin edges (red lines) end points are localized at the centers of the spectrin triangles (pink) at position . The force generated by myosin is equally distributed between the F-actin nodes (gray) connecting the spectrin triangle. D) Flowchart of the simulation.
