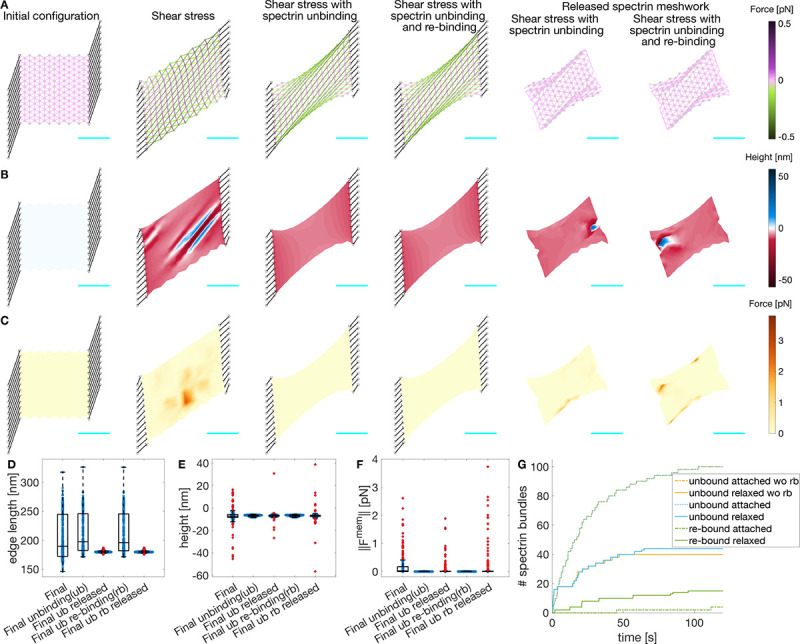
Figure 4: Actin-spectrin meshwork under shear stress.

A) Initial configuration, and after 120 seconds under shear stress, allowing unbinding of spectrin edges, and allowing unbinding and rebinding of spectrin edges. The last two columns correspond to the case when the meshwork is released from adhesions and evolved for an additional 120 seconds. Edges are color-coded for the force generated by the spectrin spring element. Black lines denote connecting edges and black circles, fixed focal adhesions with −10 nm height. The F-actin nodes (gray dots) and linker nodes (black triangles) have an initial height of 0 nm. The cyan line is a scale bar corresponding to 1μm. B) Meshwork on A but color-coded for actin node height. C) Meshwork on A but color-coded for the magnitude of the force generated by the membrane. Boxplot of the spectrin edge length (D), F-actin node height (E), and magnitude of the force generated by the membrane (F) distribution under different conditions. G) Cumulative sum of the number of unbound and re-bound spectrin edges over time.
