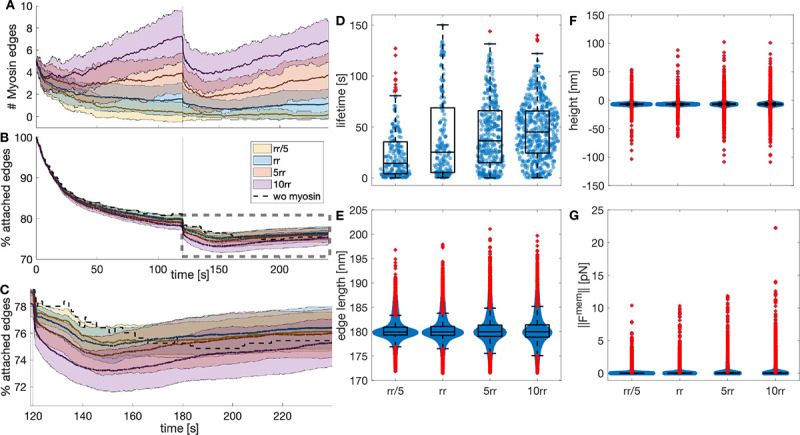
Figure 6: Myosin dynamics under different stochastic addition and removal rates.

A) Temporal evolution of the myosin edges in the actin-spectrin meshwork with different ratio of addition and removal rates (), color-coded as in B. The values correspond to . The thick line represents the mean and the shadowed area is the standard deviation from 31 simulations. B) Temporal evolution of the percentage of attached spectrin edges over time. C) Zoom image of the rectangle in B. D) Boxplot of myosin edges lifetime. Boxplot of spectrin edges length (E), F-actin nodes height (F), and magnitude of the force generated by the membrane (G) at the end of the simulation for different .
