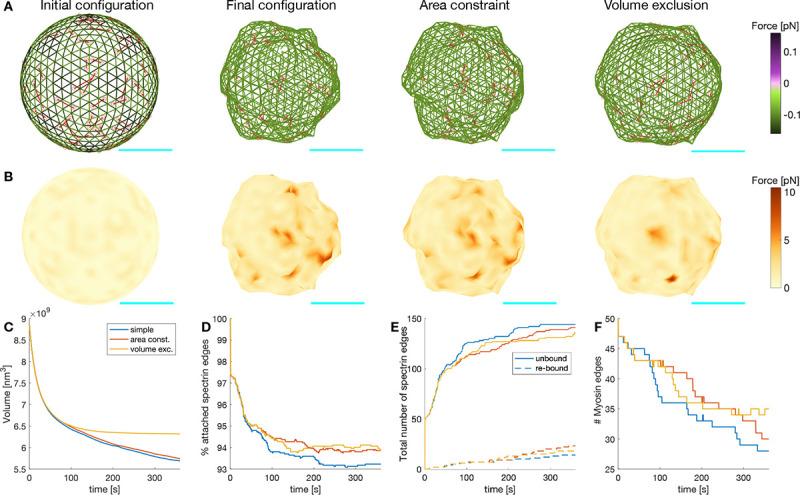
Figure 7: Actin-spectrin meshwork dynamics on a suspended cell.

A) Initial configuration of the actin-spectrin spherical meshwork and 360 seconds of the simulation, with area constraint and volume exclusion. Edges are color-coded for the force generated by the spring potential energy of the spectrin edges. Red lines correspond to myosin edges. Cyan line is a scale bar corresponding to 1 μm. B) Meshwork in A but color-coded for the force generated by the membrane. Here, . Time evolution of the volume (C), percentage of attached spectrin edges (D), total number of spectrin edges unbound and re-bound (E), and number of myosin edges (F).
