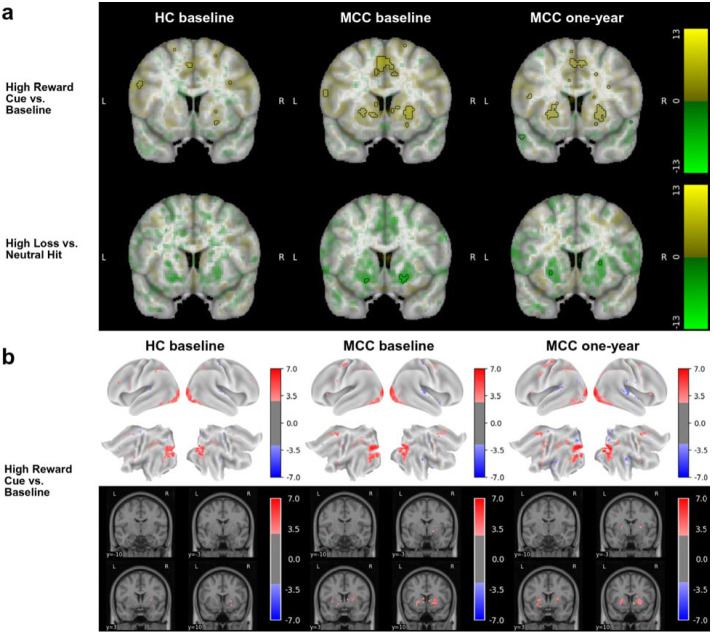
Figure 2: Brain activation for various contrasts of the MID task across groups and timepoints.
The HC group at baseline (n=23), the MCC group at baseline (n=35), and the MCC group at one-year (n=40; except High Loss vs. Neutral Hit: n=39) did not show activation differences between the two groups at baseline or between the two time points of the MCC group. Cannabis use frequency changes were not associated with brain activation at one-year. Figure 2a: Voxel-wise average brain activation, colored by effect size and opacity-scaled by z-scores with significance threshold (FDR=0.05) outlined, for the high reward cue vs. baseline contrast (top row) and the high loss vs. neutral hit feedback contrast (bottom row) of the MID task. z-thresholds: HC group at baseline=3.37 (top) and undetermined (bottom), MCC group at baseline=3.24 (top) and 4.34 (bottom), and MCC at one-year=3.10 (top) and 4.65 (bottom). Note that activation for the other contrasts was below threshold. Colorbar displays effect size. Undetermined z-threshold indicates that no voxel was statistically significant. Figure 2b: Grayordinate-wise average brain activation z-scores above significance threshold (FDR=0.05) for the high reward cue vs. baseline contrast of the MID task. z-thresholds: HC group at baseline=2.91, MCC group at baseline=2.74, and MCC at one-year=2.70. Note that activation for the other contrasts was below threshold. Colorbar displays z-scores. HC=healthy control; MCC=medical cannabis card.

