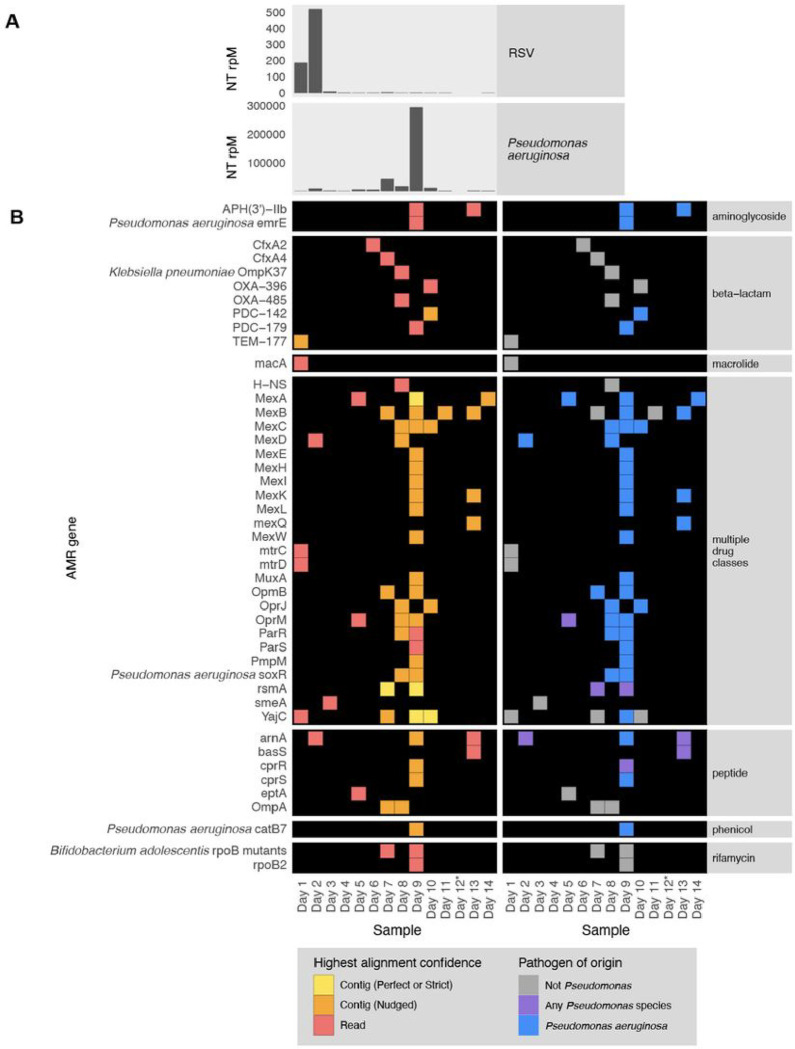
Figure 7. Longitudinal profiling of pathogen and AMR gene abundance in a patient hospitalized for severe Respiratory Syncytial Virus (RSV) infection who developed Pseudomonas aeruginosa Ventilator Associated Pneumonia (VAP).
(A) Relative abundance in reads per million (rpM) of RSV and P. aeruginosa detected by the CZ ID mNGS pipeline. (B) AMR genes detected in the lower respiratory tract microbiome at each time point. Perfect or strict AMR alignments from contigs are highlighted in yellow, while those nudged are orange. Short read alignments are in red. AMR genes mapping to Pseudomonas aeruginosa or any Pseudomonas species are highlighted in blue and purple, respectively. *Sample from Day 12 did not have enough sequencing reads but was plotted to maintain even scaling on the x-axis.

