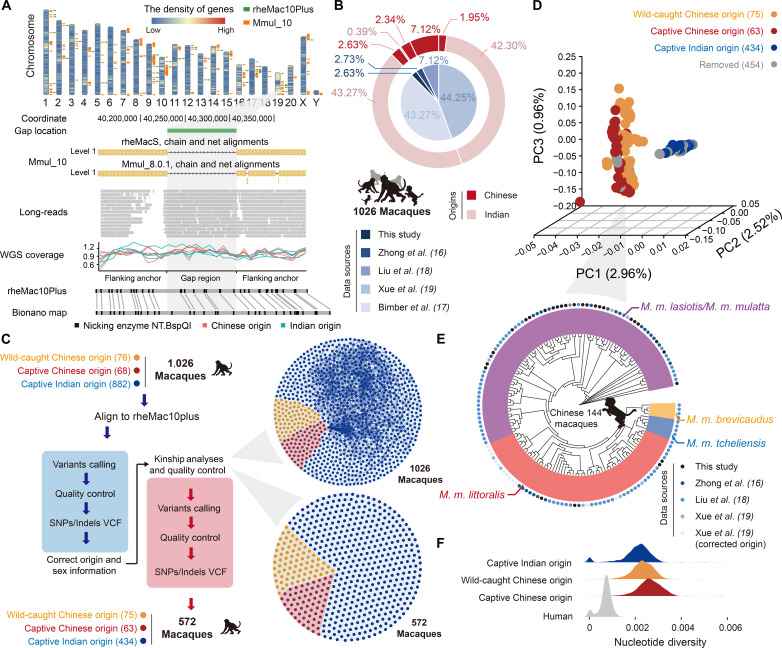
Fig. 1. Population genetic landscape of 1026 macaque genomes.
(A) Chromosome karyotype showing 40 filled gaps, as indicated by green bars in the rheMac10Plus assembly. The density of genes across the genome is shown in the heatmap. For one of the filled gaps on chromosome 19, the Bionano optical map of one macaque, the long reads of eight macaques, and the coverage of the short reads of 10 macaques (red: Chinese-origin macaques; green: Indian-origin macaques) were aligned and shown accordingly. (B) Sources (inner layer) and geographic origins (outer layer) of the 1026 macaques. (C) Schematic diagram of the workflow for variant calling with a two-round strategy (blue: first round of calling; red: second round of calling). The original set of macaques (1026 animals) and the set after quality control (572 animals) were partitioned into three clusters (red: captive Chinese-origin macaques; yellow: wild-caught Chinese-origin macaques; blue: captive Indian-origin macaques) based on their genetic profiles. The pairs of macaques with significant kinship relationships are linked by lines. (D) Three-dimensional PCA plot showing the relationships of the 572 macaques according to SNV genotypes. (E) Neighbor-joining tree showing the genetic distance of the Chinese-origin macaques. Different data sources are indicated by colored dots in the outer layer. Yellow: M. m. brevicaudatus; blue: M. m. tcheliensis; orange: M. m. littoralis; purple: M. m. lasiotis or M. m. mulatta. (F) The genome-wide distribution of nucleotide diversity of captive Indian-origin macaques (blue), captive Chinese-origin macaques (red), wild-caught Chinese-origin macaques (yellow), and humans (gray).

