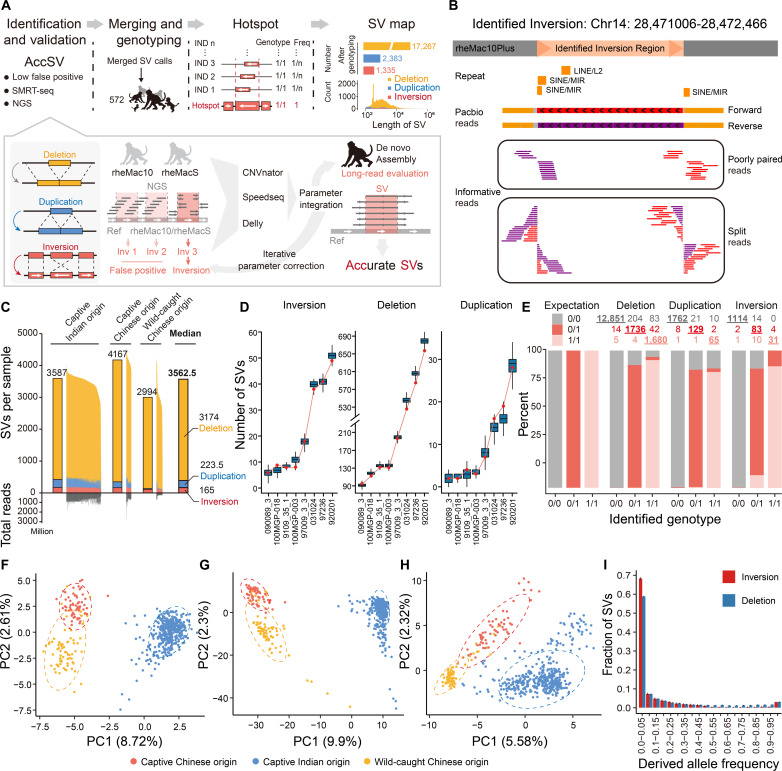
Fig. 2. Construction and characterization of SV map for macaque population.
(A) The pipeline for SV map construction, including the processes of SV identification, validation, genotyping, SV hotspot definition, and allele frequency calculation. (B) The genomic region of one inversion we identified was shown as an example, with the split reads, poorly paired reads, and the long reads supporting its existence aligned and shown accordingly. (C) The distribution of the count of SVs per macaque genome for three types of SVs in macaques of different origins. The median number of SVs is shown for each group. The total number of reads of deep sequencing for each macaque is also shown. (D) Verification of the SV events with long HiFi reads of eight macaques. Boxplots showing the distribution of the theoretical number of verified SVs at the current sequencing depth of HiFi reads, obtained from 10,000 times of simulations. The detected number of verified SVs in each macaque was indicated by the red dot. (E) Validation of the genotypes of SVs in one macaque based on the long-read sequencing and genome assembly in one macaque. For each type of genotype identified with short reads (0/0, 0/1, or 1/1), the percentages of verified SVs are summarized and shown in different colors. The numbers of SVs of each type are shown, and those with verified genotypes are underlined. (F to H) PCA plots showing the relationships of the 562 macaques according to the genotypes of inversion (F), deletion (G), and duplication (H) variations. Macaques with different origins are labeled with different colors. (I) Site frequency spectra of the derived alleles for inversions and deletions in 562 macaques.

