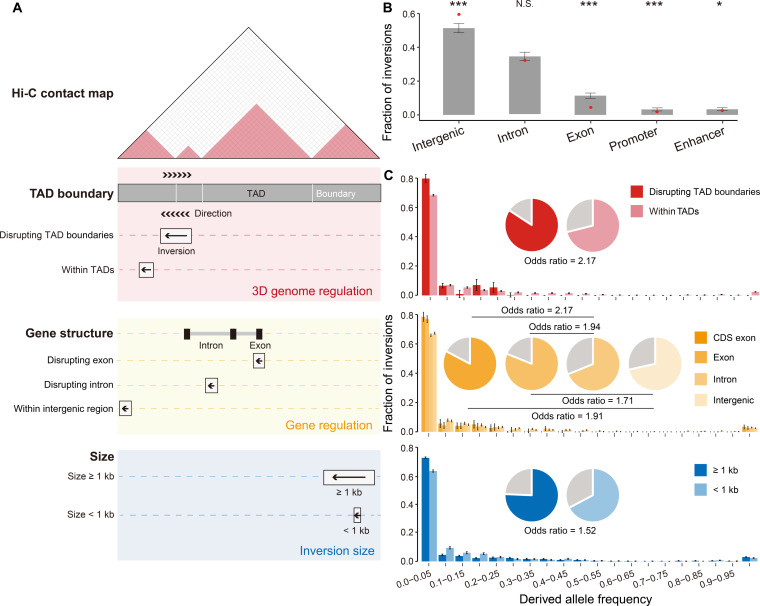
Fig. 3. Inversions in regulatory regions are selectively constrained.
(A) Classification of inversions by different features and genomic locations, including the sizes of the inversions, their locations on the genes, and their three-dimensional genomic architecture. (B) Proportions of inversions at different genomic locations. The background distribution of inversions located in each genomic region, as estimated based on 1000 shuffled regions with matched lengths, is shown in a bar plot, with the error bars representing the standard deviations. For each bar plot, the observed value is indicated as a red dot, with the empirical P value calculated as the percentage of the 1000 replicates. *P < 0.05, ***P < 0.001, N.S., not significant. (C) Site frequency spectra of the derived allele for different classifications of inversions. For each group of inversions, the fraction of inversions with a low frequency of derived alleles (less than 5%) is shown and compared, with the odds ratios shown accordingly.

