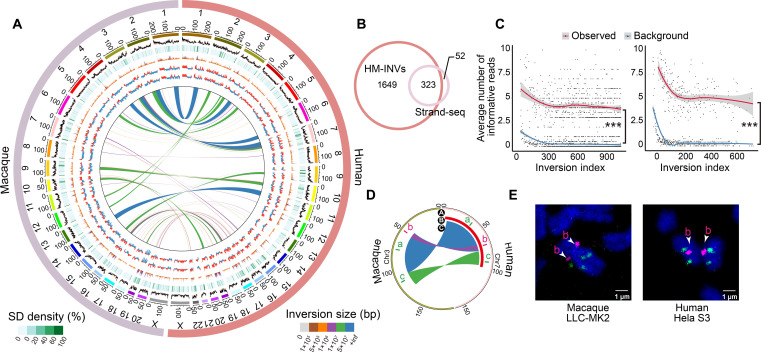
Fig. 4. Identification and verification of species-specific inversions between humans and macaques.
(A) Circos plot showing the profile of inversions across humans and macaques (HM-INVs), with genomic features aligned according to the coordinates. From the outside to the inside: GC content (%), segmental duplication (SD) density (%), gene density, A/B compartments from fetal cortical plates (CP) and germinal zone (GZ), and the locations of HM-INVs. The average GC contents are indicated by orange lines. Tracks are plotted in 500-kb windows. (B) Overlap between HM-INVs in this study and the public list of species-specific inversions between humans and macaques as defined by in Maggiolini et al. (4) (Strand-seq). (C) Validation of species-specific inversions between humans and macaques with Strand-seq data. For candidate inversions with reads coverage ≥3 in the Strand-seq study, the average numbers of Strand-seq informative reads (Observed) were shown and compared with the background (Background, see details in Materials and Methods), for candidates identified specifically in our study (left), or by both studies (right). Inversions were arranged in descending order of their length. Local regression curves for the average numbers of the informative reads (red) and the background (blue) were shown. Wilcoxon rank-sum tests, ***P < 0.001. (D) Circos plot depicting the arrangement of one complex HM-INV chosen for FISH validation. The track A represents the genomic regions where the probes were designed, with the order of colors indicating the expected form of inversions in humans and macaques based on the definition in this study. Tracks B and C display the forms of these inversions identified by Strand-seq (one large inversion) and in this study (three complex inversions with breakpoint reuse), respectively. (E) Validation of the complex HM-INV in (D) in the macaque LLC-MK2 cell line (left) and human HeLa S3 cell line (right).

