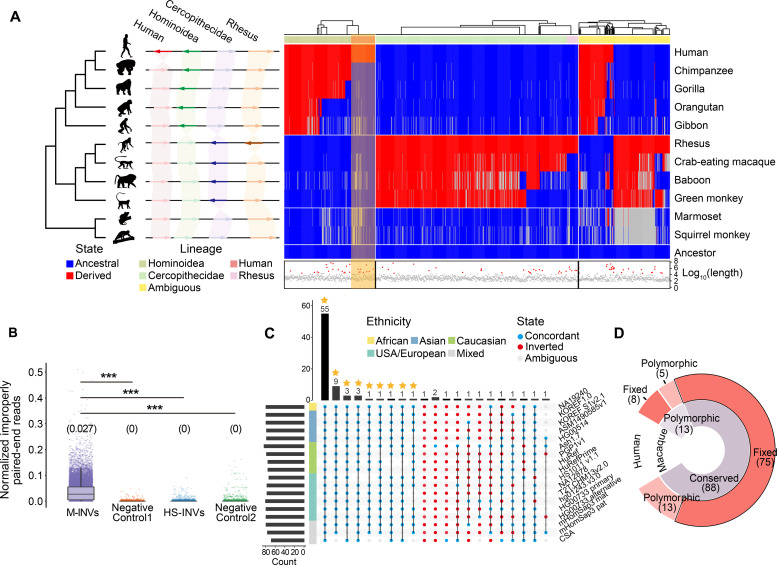
Fig. 5. Identification of human-specific inversions.
(A) Schematic illustration (left) of four classes of lineage-specific inversions, including human-specific (Human), Hominoidea-specific (Hominoidea), Cercopithecidae-specific (Cercopithecidae), and macaque-specific (Rhesus) inversions. Heatmap (right) showing the arrangement of HM-INVs in comparison to the estimated ancestral states. HM-INVs are ordered in columns, and each row corresponds to a species based on the phylogeny. Blue: the ancestral allele; red: the derived allele; gray: ambiguous state. The hierarchical clustering of HM-INVs and the lineage specificity annotation for HM-INVs are shown at the top. The log10-transformed length for each HM-INV is shown at the bottom, among which the HM-INVs with lengths >95% quantile are indicated with red triangles. (B) The distribution of the normalized number of improperly aligned, paired-end reads, for different groups of regions. M-INVs: macaque polymorphic inversions with high frequency; HS-INVs: human-specific inversions; Negative Control1 and Negative Control2: two groups of negative controls of shuffled regions (Materials and Methods). The median read number is shown above each boxplot. (C) UpSetR plot showing the number of human-specific inversions that are grouped based on their orientation relative to the reference genome across 18 haplotype assemblies. Blue: alignments concordant with hg38; red: inverted form; gray: ambiguous alignments. Human-specific inversions fixed in the population are highlighted with asterisks. Wilcoxon rank-sum tests, ***P < 0.001. (D) Donut plot showing the classification of 101 candidate human-specific inversions based on their polymorphic states in human and macaque populations.

