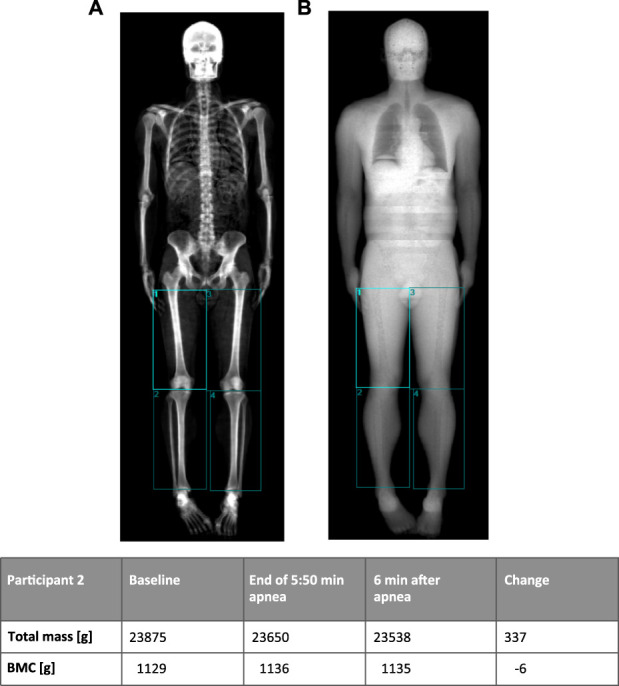
FIGURE 5.

Example of DXA-scan (participant 2) with manually drawn regions in the lower extremities using bone tissues (A) and soft tissue (B) images to place regions. The table shows changes in mass of the lower extremities (sum of the four regions) before and after 5 min 50 s breath hold. Note that the bone mineral content (BMC) remains unchanged, indicating minimal movement of the participant (A image).
