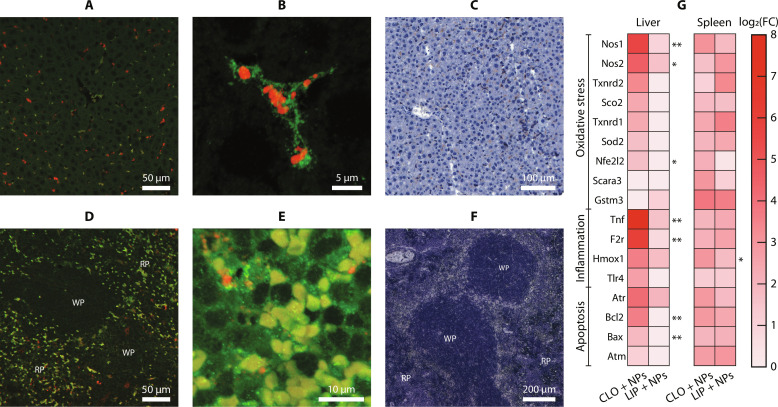
Fig. 5. Microscopic and toxicological analysis.
Confocal images of liver tissues of a mouse administered with MoO2-SiO2 NPs and pre-injected with empty liposomes (LIP), using immunofluorescence staining (F4/80 in green, Cy5.5 in red) at (A) 10× and (B) 63×. (C) Microscopy image of liver tissue from the same mouse with chromogenic immunostaining (F4/80, DAB). Confocal images of spleen tissues of a mouse administered with MoO2-SiO2 NPs and pre-injected with clodronate-encapsulated liposomes (CLO), using immunofluorescence staining (F4/80 in green, Cy5.5 in red) at (D) 10× and (E) 63×. (F) Microscopy image of spleen tissue from the same mouse with chromogenic immunostaining (F4/80, DAB), highlighting red pulp (RP) and white pulp (WP). (G) Gene expression quantitative reverse transcription polymerase chain reaction (PCR) in liver and spleen tissues from mice administered with MoO2-SiO2 NPs, preinjected with CLO or LIP. The intensity is proportional to the log fold change (FC) determined in relation to control tissues. Significant difference between the two groups was indicated when *P < 0.05 or **P < 0.005.

