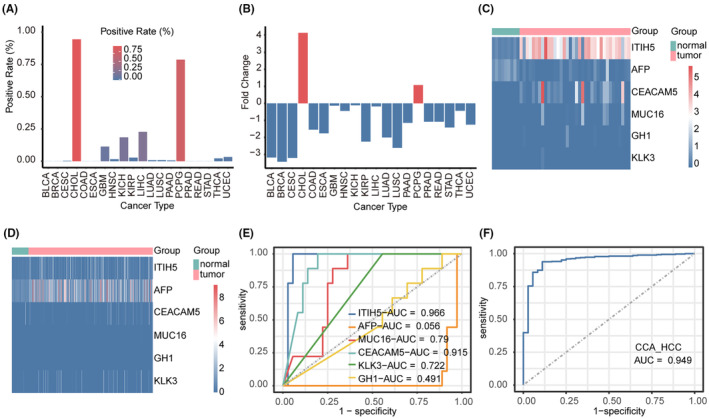
FIGURE 4.

The diagnostic value of ITIH5 at the mRNA level for cholangiocarcinoma (CCA). (A) The positive rate of ITIH5 in the various cancer types. (B) Fold change in ITIH5 expression in the various cancer types. (C) Heatmap illustrating the expression level of ITIH5 and the tumor markers in TCGA‐CHOL. (D) Heatmap illustrating the expression level of ITIH5 and the tumor markers in TCGA‐LIHC. (E) ROC curve illustrating the diagnostic significance of ITIH5 and the tumor markers in CCA. (F) ROC curve illustrating the diagnostic significance of ITIH5 in distinguishing between CCA and hepatocellular carcinoma (HCC). CHOL, bile duct cancer; LIHC, liver hepatocellular carcinoma.
