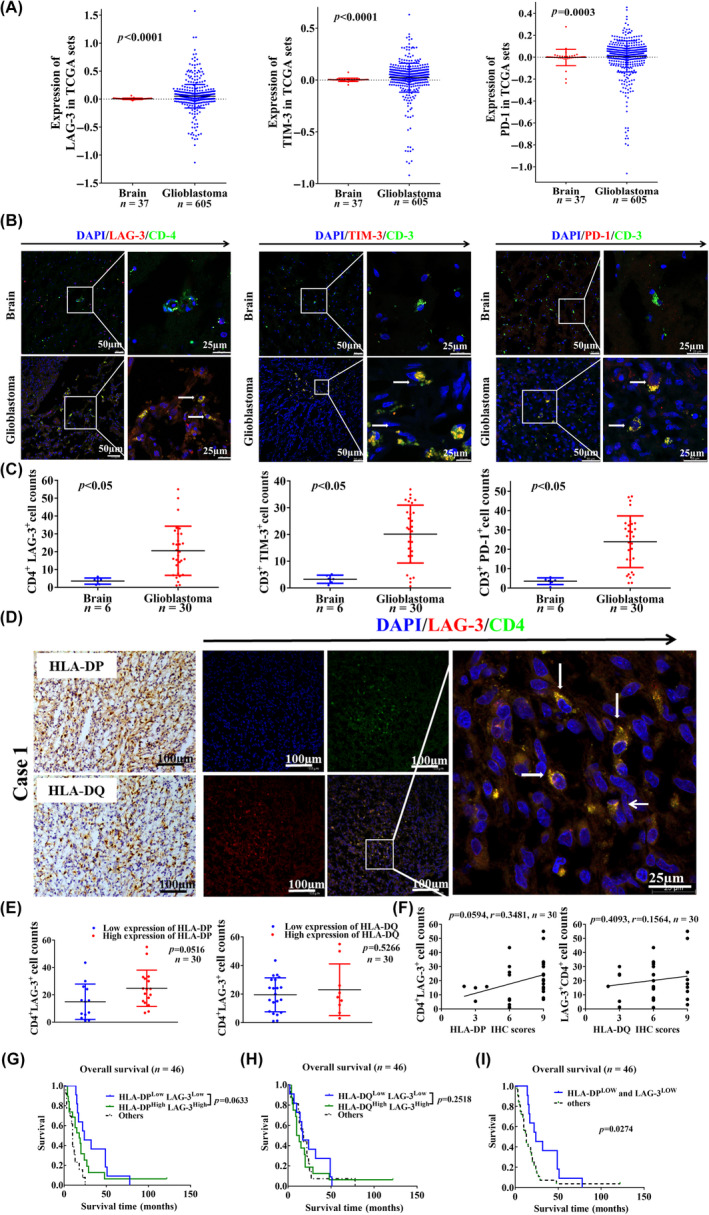
FIGURE 2.

Human leukocyte antigen‐II (HLA‐II) expression is related to the infiltration of lymphocyte‐activation gene 3 (LAG‐3)+CD4+ T cells in glioblastoma (GBM). (A) Evaluation of LAG‐3, T cell immunoglobulin domain and mucin domain‐3 (TIM‐3), and programmed cell death protein 1 (PD‐1) expression from the TCGA. (B) Thirty cases of frozen GBM samples and six cases of control brain samples were collected, and immunofluorescence staining showed that LAG‐3 was colocalized with CD4, and TIM‐3 and PD‐1 were colocalized with CD3 in the tumor stroma. White arrows indicate colocalized cells. (C) The number of LAG‐3+CD4+, TIM‐3+CD3+, and PD‐1+CD3+ cells in GBM and control samples is shown (p < 0.05). (D) Thirty cases of frozen GBM and six control samples were collected, and immunofluorescence staining indicated that LAG‐3+CD4+ cells in the tumor stroma, which is associated with HLA‐DP and HLA‐DQ expression. White arrows indicate colocalized cells. (E) The correlation between number of CD4+LAG‐3+ T cell infiltration and HLA‐DP is shown. (F) The correlation between HLA‐DP expression and the number of CD4+LAG‐3+ T cells is shown. (G, H) Based on both HLA‐II and LAG‐3 expression in paraffin‐embedded GBM specimens, overall survival was analyzed according to HLA‐IIHighLAG‐3High and HLA‐IILowLAG‐3Low (n = 46). (I) Kaplan–Meier curves for survival outcomes of patients are shown according to low expression of HLA‐DP and LAG‐3 (n = 46).
