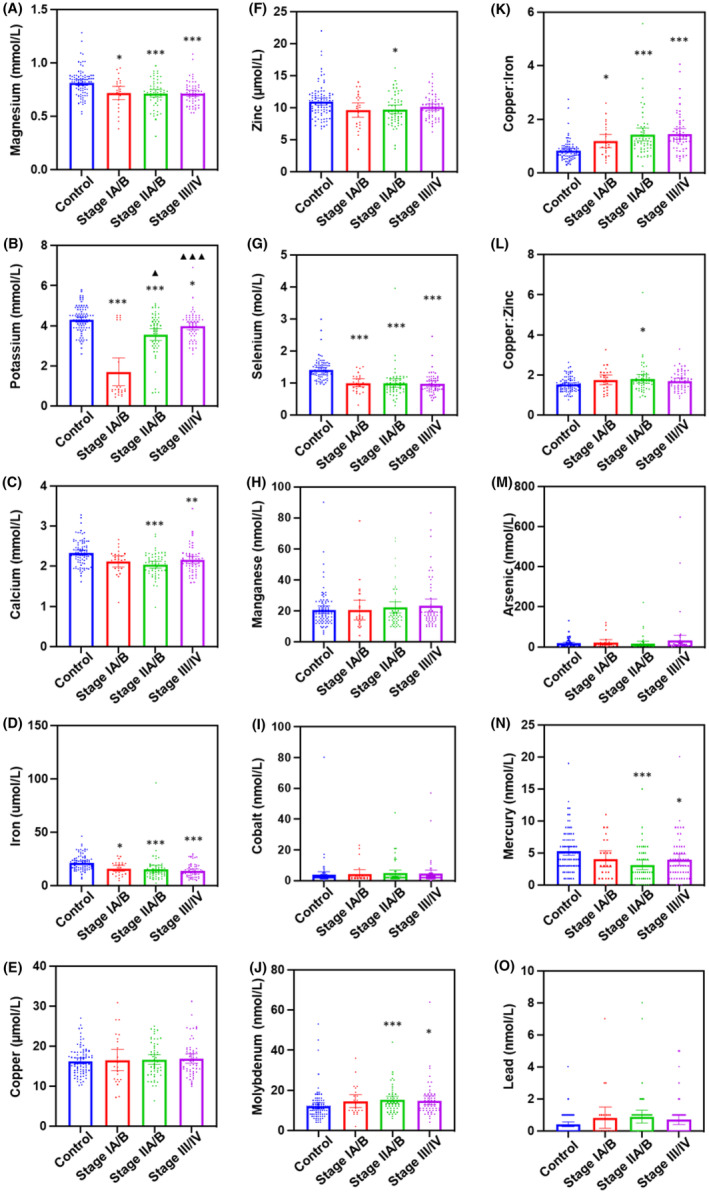
FIGURE 1.

Serum metal level comparison between healthy controls and patients at different stages of PDAC. The levels of metals were compared between healthy controls, Stage IA/B, Stage IIA/B and Stage III/IV PDAC patients. (A) Magnesium (Mg); (B) potassium (K); (C) calcium (Ca); (D) iron (Fe); (E) copper (Cu); (F) zinc (Zn); (G) selenium (Se); (H) manganese (Mn); (I) cobalt (Co); (J) molybdenum (Mo); (K) Cu:Fe; (L) Cu:Zn; (M) arsenic (As); (N) mercury (Hg); and (O) lead (Pb). *p < 0.05; **p < 0.01; ***p < 0.001 compared with healthy controls. ▲ p < 0.05; ▲▲▲ p < 0.001 compared with Stage IA/B.
