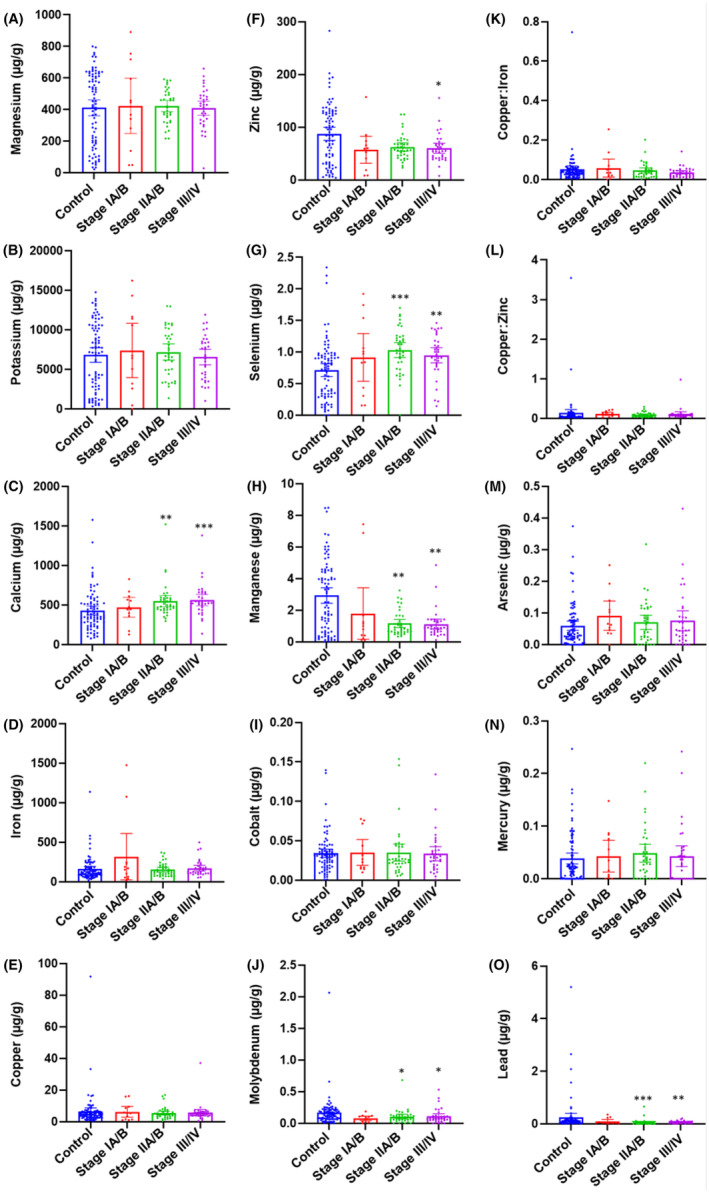
FIGURE 2.

Tissue metal level comparison between adjacent normal pancreas and pancreatic tumor tissues at different stages of PDAC. The levels of metals were compared between adjacent normal pancreas and tumor tissue from PDAC patients at Stage IA/B, Stage IIA/B and Stage III/IV. (A) Magnesium (Mg); (B) potassium (K); (C) calcium (Ca); (D) iron (Fe); (E) copper (Cu); (F) zinc (Zn); (G) selenium (Se); (H) manganese (Mn); (I) cobalt (Co); (J) molybdenum (Mo); (K) Cu:Fe; (L) Cu:Zn; (M) arsenic (As); (N) mercury (Hg); and (O) lead (Pb). *p < 0.05; **p < 0.01; ***p < 0.001 compared with healthy controls. ▲ p < 0.05; ▲▲▲ p < 0.001 compared with Stage IA/B.
