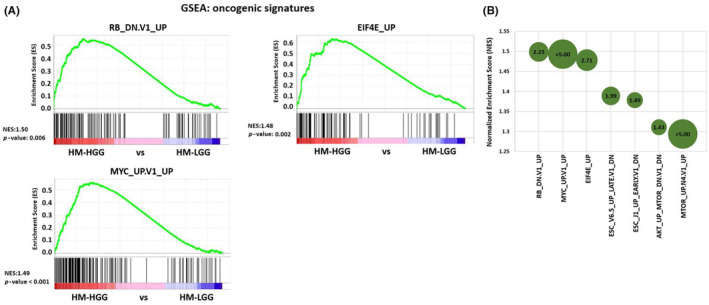
FIGURE 3.

Gene Set Enrichment Analysis (GSEA) of high‐grade gliomas (HGG) compared with low‐grade glioma (LGG). (A) GSEA analysis of oncogenic signatures in the current cases. HGG (after malignant progression [MP]) compared with LGG (before MP) suggests upregulation of oncogenic signature gene sets involved in cell‐cycle processes (e.g., RB_DN.V1_UP, EIF4E_UP, MYC_UP.V1_UP) during MP. (B) Balloon chart displaying GSEA enrichment score and the significance of HGG compared with LGG. Balloon size represents −log10(p‐value), with the value written inside each balloon. Gene sets are plotted in order of normalized enrichment score.
