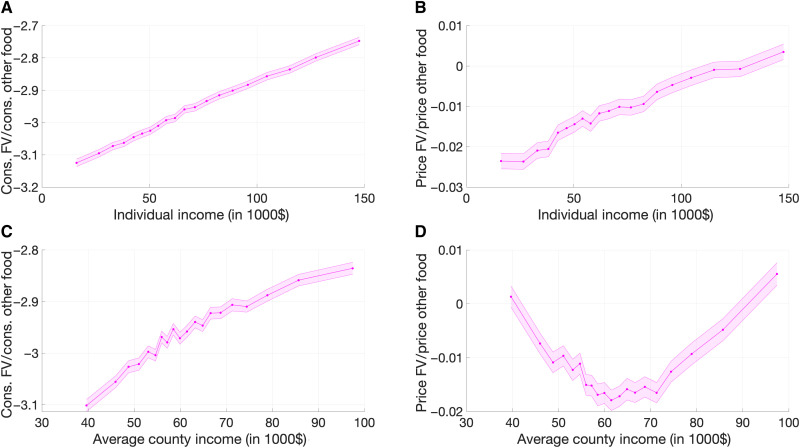
Fig. 1. Relative consumption and prices.
(A) Consumption of fruits and vegetables (FV) as a fraction of total food consumption against individual income. (B) Relative price of FV against individual income. (C) Consumption of FV as a fraction of total food consumption against income across counties. (D) Relative price of FV against income across counties. The shaded areas represent a two-standard error confidence band. Each point is a 5-percentile bin.

