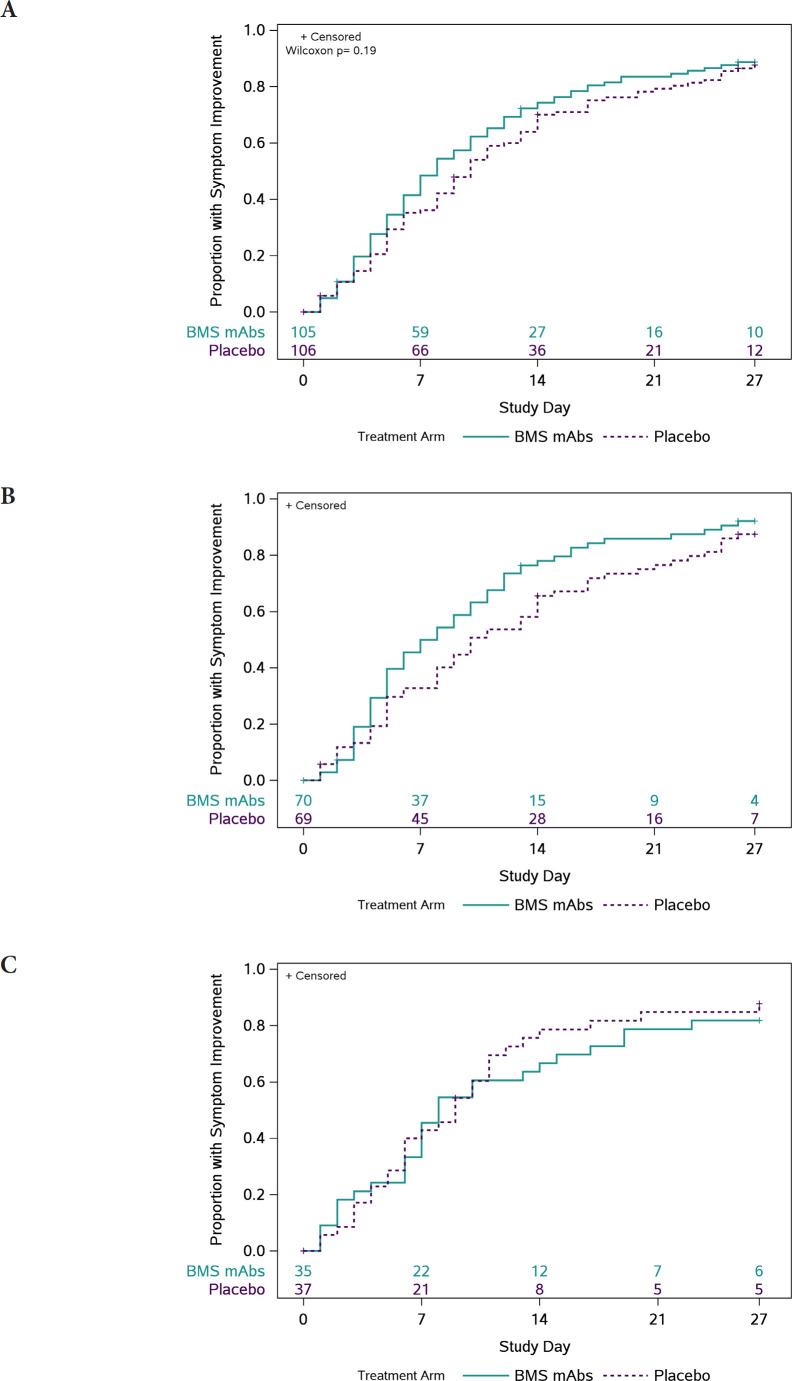
Figure 1.
Time (days) to all targeted symptoms improved from day 0 for 2 consecutive days, overall, and by days from symptom onset to enrollment. The cumulative proportion of participants with all symptoms improved for 2 consecutive days was calculated using Kaplan-Meier methods for all participants (Panel A), participants who were randomized ≤ 5 days from symptom onset (Panel B), and randomized > 5 days from symptom onset (Panel C). Numbers above the x-axis indicates the number of participants still in follow-up who have not previously had 2 consecutive days with all targeted symptoms improved.

