
Fig 3. Lower-limb joints’ negative and positive powers.
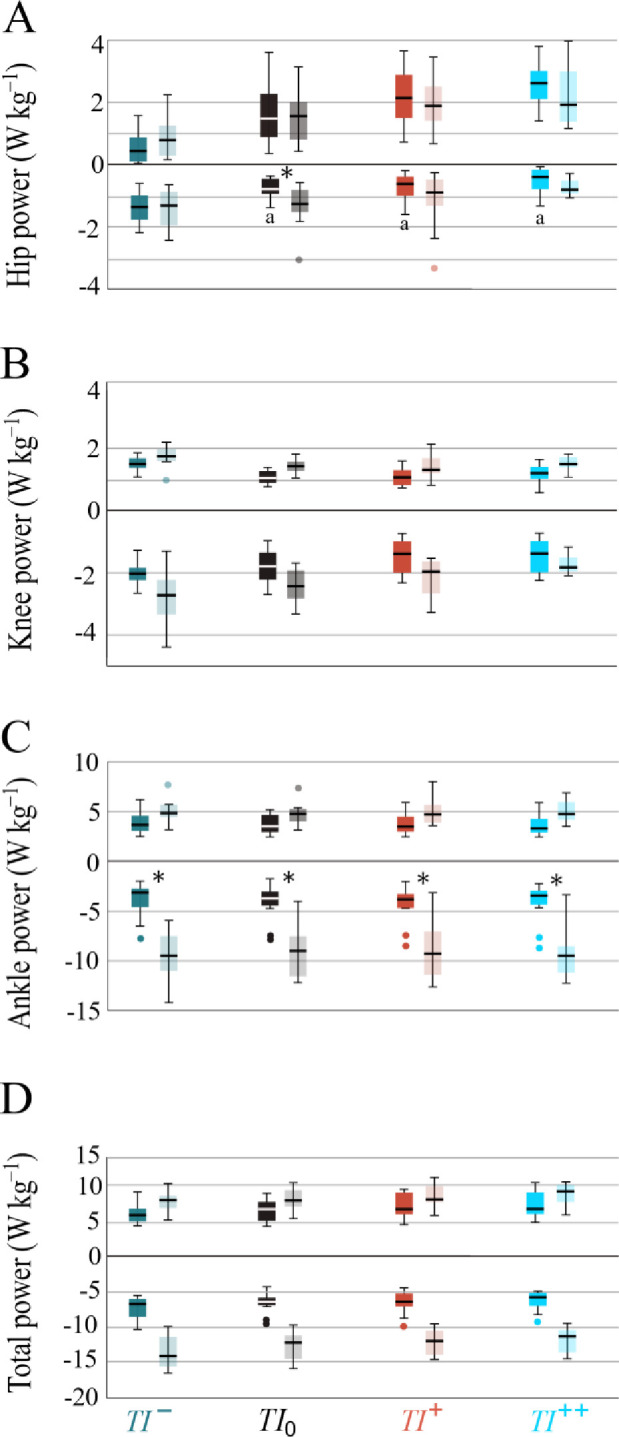
Boxplots depict the average negative and positive powers produced at the (A) hip, (B) knee, (C) ankle and (D) total (sum of the hip, knee and ankle) during running with backward (TI¯; green), self-selected (TI0; black), low forward (TI+; red) and high forward (TI++; blue) trunk inclinations across the level-step (darker) and the drop-step (lighter). a: significant difference from TI¯; *: significant difference from the level-step (p < 0.05). Error bars denote ± 1 SD.