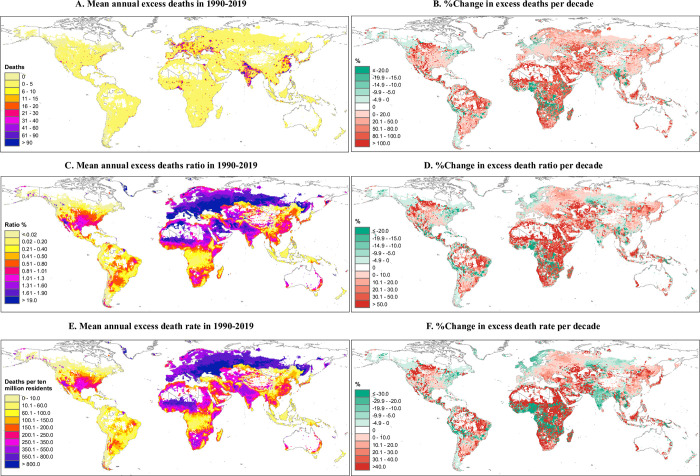
Fig 2.
Average and the change per decade of excess deaths (A, B), death ratio (%, C, D), and deaths per 10 million residents (E, F) associated with heatwaves in 1990–2019 at a spatial resolution of 0.5°×0.5°. Only grid cells with at least 1 annual death were included. . Change per decade is calculated using a linear regression. The base layer of the world map was imported from the public domain Natural Earth project (source: https://www.naturalearthdata.com/downloads/; terms of use: www.naturalearthdata.com/about/terms-of-use/). Summarised data at the country level are provided in S6, S8, and S10 Tables.

