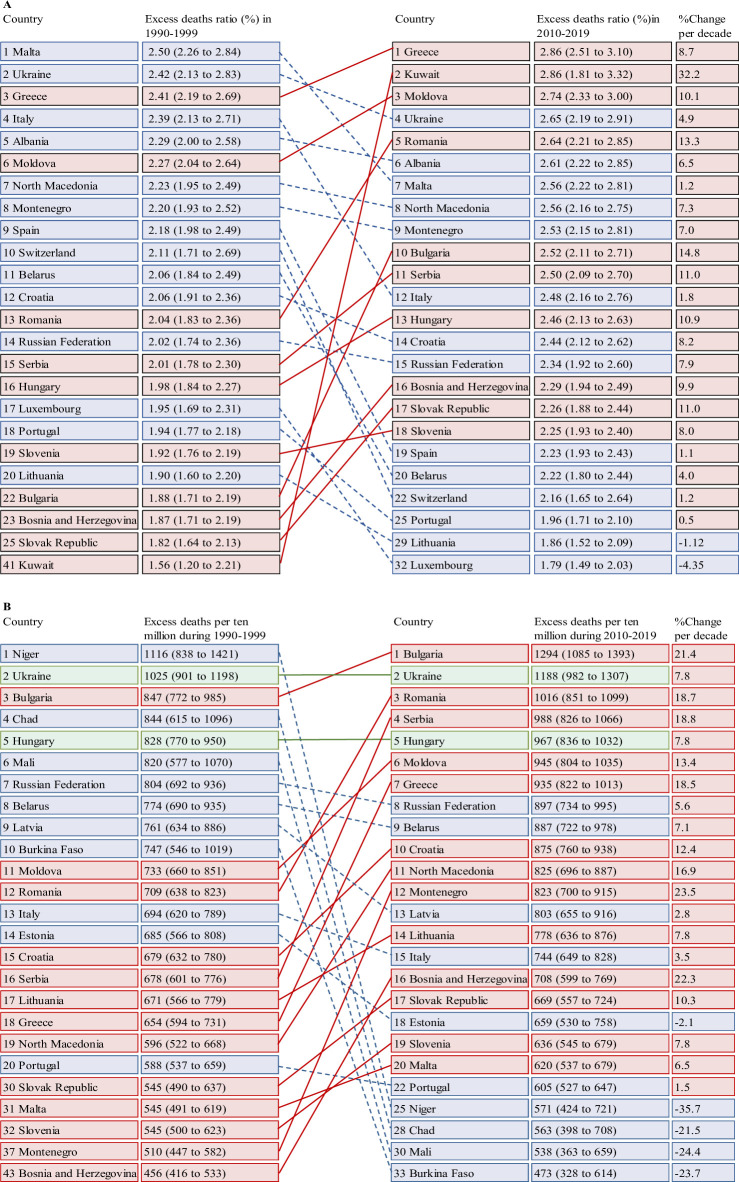
Fig 3. Leading 20 countries for excess death ratio (%) and deaths per 10 million residents associated with heatwaves per warm season from 1990–1999 to 2010–2019.
. Change per decade is calculated using a linear regression. Some countries might drop out or new countries may appear from the first to the last decade due to the changing burden. The underlying data are provided in S8 and S10 Tables.

