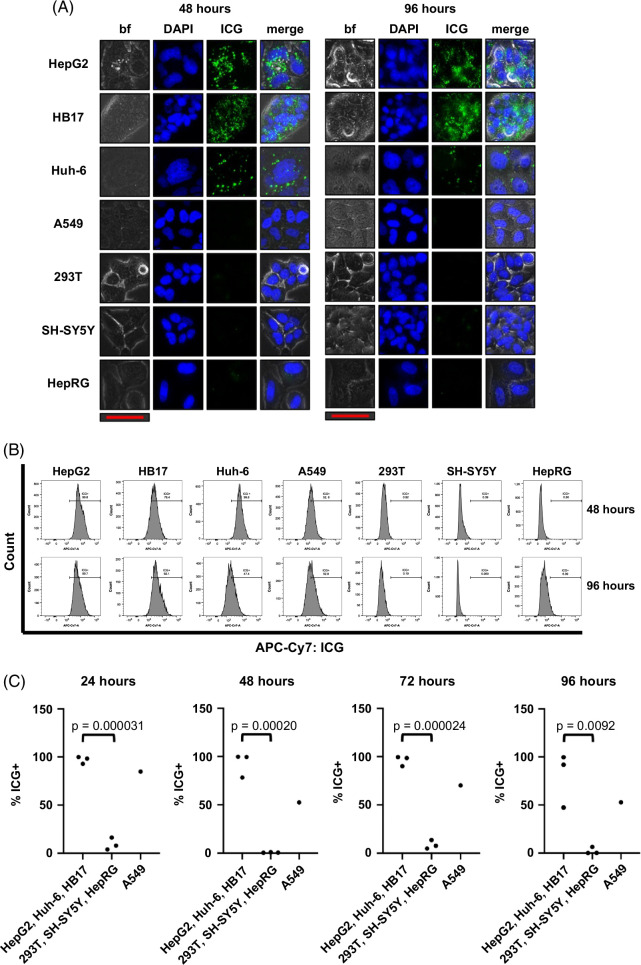
FIGURE 1.
ICG selectively accumulates in liver cancer cells. Cells stained with 25 μM ICG for 1 hour and then imaged or analyzed by flow cytometry 48 and 96 hours after incubation. There is clear ICG accumulation in the HepG2, Huh-6, and HB17 HB tumor cells at these time points, while the nontumor HepRG cell line, the non-liver SH-SY5Y and A549 cell lines, and the non-liver and nontumor 293T cell line lack ICG. (A) Images of cells, which were also tagged with DAPI to show nuclei present in each image. The scale bar (red) represents 50 μm. Merge is bf, DAPI, and ICG images overlaid in 1 image. The exposure time is 5 seconds. (B, C) Histograms of the DAPI+/ICG+ population in each sample analyzed by flow cytometry shown in (B). Percent positive for ICG+ shown in (C) with statistical significance analyzed by Student t test (2-tailed). Abbreviations: bf, brightfield; ICG, indocyanine green.

