FIGURE 3.
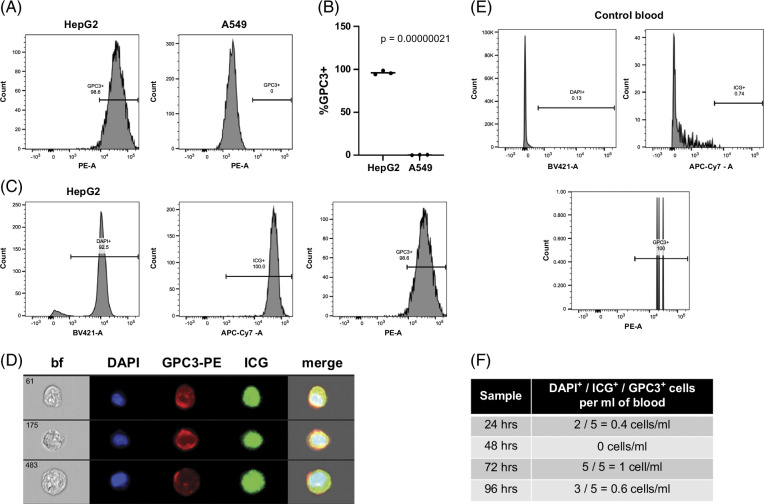
A marker panel of ICG, GPC3, and DAPI can be used to unambiguously identify liver tumor cells. (A, B) Flow cytometry for GPC3 with HepG2 positive control cells and A549 negative control cells shows the specificity of GPC3 for HepG2 cells that express this protein. Histograms of the DAPI+/GPC3+ population in each sample shown in (A). Percent DAPI+/GPC3+ for each sample graphed in (B) with statistical significance analyzed by Student t test (2-tailed). (C) Gating strategy for samples run with the DAPI/ICG/GPC3 panel. Single cells were first separated by gating with FSC and SSC as described in the Methods section. DAPI+/ICG+/GPC3+ cells were then separated and counted on histograms as follows: (1) DAPI+ enucleated cells, (2) ICG+ cells, and (3) GPC3+ cells. This is shown for a representative HepG2 sample. (D) Images of DAPI+/ICG+/GPC3+ HepG2 cells analyzed by the Amnis ImageStream instrument. (E) Gating strategy for control samples run with the DAPI/ICG/GPC3 panel. Single cells were first separated by gating with FSC and SSC as described in the Methods section. DAPI+/ICG+/GPC3+ cells were then separated and counted on histograms as follows: (1) DAPI+ enucleated cells, (2) ICG+ cells, and (3) GPC3+ cells. This is shown for the sample incubated with ICG for 96 hours. (F) DAPI+/ICG+/GPC3+ cells present in noncancer control blood samples. Blood samples were processed as described in the Methods section, and samples were stained with ICG for 1 hour, followed by resting in standard cell culture conditions in HBM for the indicated amount of time. Samples were then analyzed by flow cytometry on a BD Symphony instrument for numbers of DAPI+/ICG+/GPC3+ cells. All samples showed 1 cell or fewer per mL of blood. Abbreviations: bf, brightfield; FSC, forward scatter; GPC3, Glypican-3; HBM, hepatocyte basal medium; ICG, indocyanine green; SSC, side scatter.

