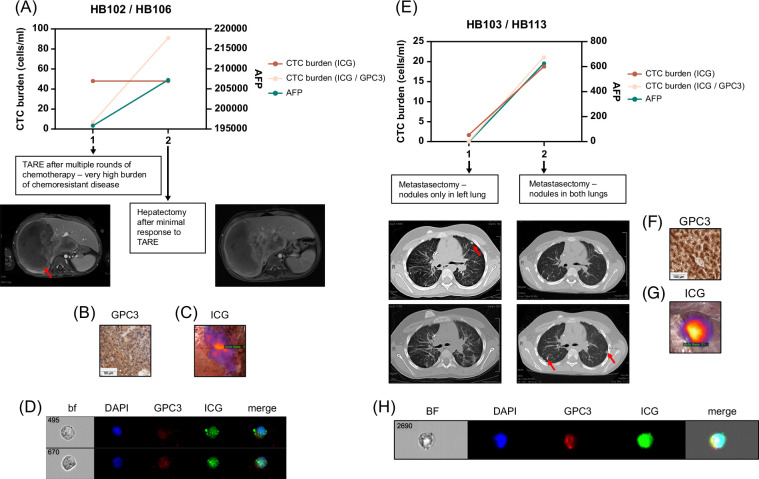
FIGURE 5.
CTC burden in 2 high-risk patients, HB102/106 (A–D) and HB103/113 (E–H). (A) We obtained samples at 2 time points during the patient’s course of treatment. We analyzed CTC burden after processing whole blood and tagging CTCs with ICG, GPC3, and DAPI, as described. We graphed CTC burden (cells/mL) and serum AFP levels, and both show an increase, correlating with the patient not responding to therapy. AFP was assessed by standard clinical tests. DAPI+/ICG+/GPC3+ cell number shown is an average of counts by the standard and imaging flow cytometers for both samples. The DAPI+/ICG+ cell number shown was measured by the standard flow cytometer. CT scans from the time of TARE and the time of hepatectomy showed a minimal decrease in tumor (red arrow) size. (B, C) Validation of GPC3+ and ICG+ primary samples from patients. (B) Histology of primary patient tumor sample showing positivity of sample for GPC3. The scale bar represents 50 μm. (C) Near-infrared imaging of ICG+ primary tumor during hepatectomy. (D) Image of 2 ICG+/GPC3+/DAPI+ CTCs from Amnis ImageStream instrument. (E) We obtained samples at 2 time points during the patient’s course of treatment. We analyzed CTC burden after processing whole blood and tagging CTCs with ICG, GPC3, and DAPI, as described. We graphed CTC burden (cells/mL) and serum AFP levels, and both show an increase, correlating with the patient not responding to therapy. AFP was assessed by standard clinical tests. The DAPI+/ICG+/GPC3+ cell number shown is an average of counts by the standard and imaging flow cytometers for both samples. The DAPI+/ICG+ cell number shown was measured by the standard flow cytometer. CT images shown are the same slices in rows from 2 metastasectomy procedures, showing nodules in the left lung at the first time point (red arrow, left images) and new nodules present in both lungs (red arrows, right images) at the second time point. (F, G) Validation of GPC3+ and ICG+ primary samples from patients. (F) Histology of primary patient tumor sample showing positivity of sample for GPC3. The scale bar represents 100 μm. (G) Near-infrared imaging of ICG+ lung nodule during metastasectomy. (D) Image of ICG+/GPC3+/DAPI+ CTCs from Amnis ImageStream instrument. Abbreviations: AFP, alpha-fetoprotein; bf, brightfield; CTC, circulating tumor cell; GPC3, Glypican-3; ICG, indocyanine green; TARE, transarterial radioembolization.

