
Figure 4: Myeloma progression is associated with a reduced ratio of IFNγ+ TPHEX and TPEX to myeloma cells.
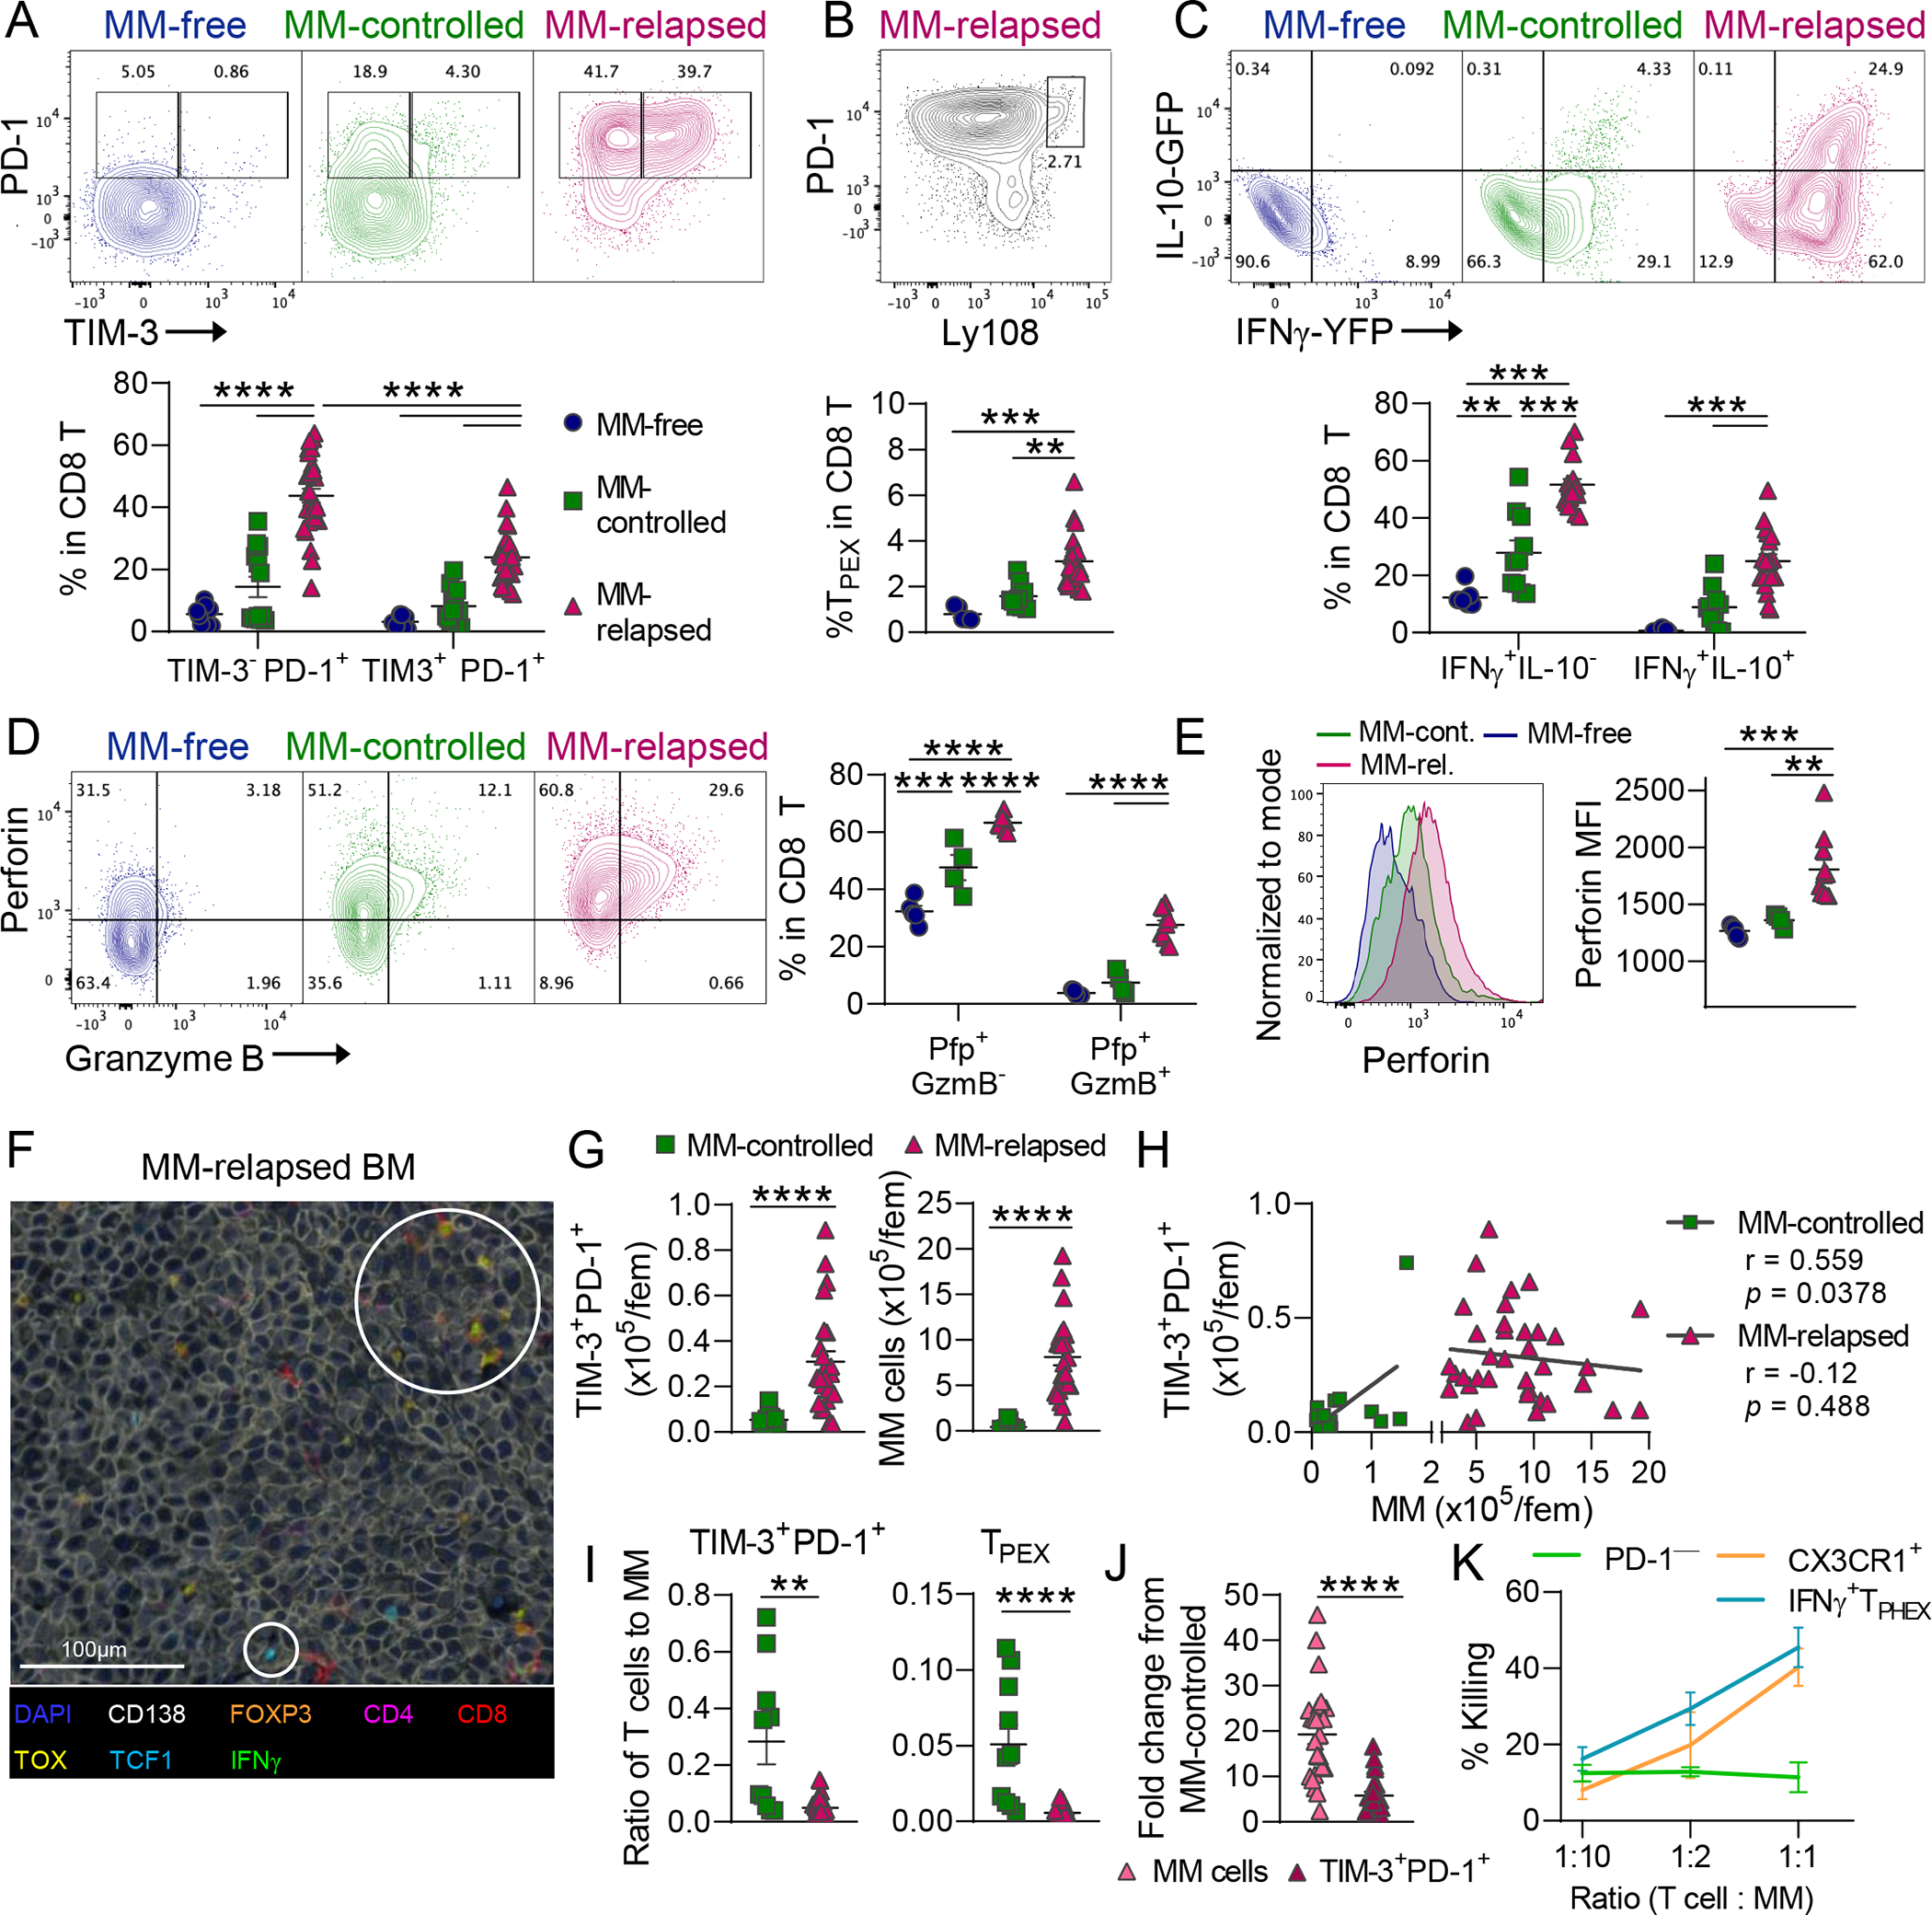
Recipient C57Bl/6 × PTPRCA (CD45.1/CD45.2) mice were transplanted with HULK donor (IFNγ-YFP × IL-10-GFP × FoxP3-RFP; CD45.2) grafts. Recipients were either never injected with tumor (MM-free) or had controlled (MM-controlled) or progressive myeloma (MM-relapsed) at 6–7 weeks post-transplant. BM was harvested for analysis of CD8 T cells using flow cytometry. (A) Representative contour plots and frequency of PD-1+TIM-3− and PD-1+TIM-3+ cells (MM-free n = 8; MM-controlled n = 10; MM-relapsed n = 19). Kruskal-Wallis with Dunn’s Test. (B) Representative contour plot and frequency of TPEX (Ly108hi PD-1+) cells. (MM-free n = 5; MM-controlled n = 9; MM-relapsed n = 24). Kruskal-Wallis with Dunn’s Test. (C) Representative contour plots and frequency of IFNγ+IL-10− and IFNγ+IL-10+ cells (MM-free n = 8; MM-controlled n = 10; MM-relapsed n = 19). One-way ANOVA with Tukey’s test. (D) Representative contour plots and frequency of Pfp+GzmB− and Pfp+ GzmB+ cells and (E) histograms and MFI of perforin in all Pfp+ cells (MM-free n = 5; MM-controlled n = 4; MM-relapsed n = 11). One-way ANOVA with Tukey’s test. (F) Sternum was harvested at MM relapse for VECTRA multispectral imaging of myeloma lesions in BM. White circles highlight populations of interest including TOX+ and TCF1+ CD8 T cells. (G) Quantification and (H) correlation of TIM-3+PD-1+ CD8 T (left) and MM (right) cell numbers in controlled and relapsed recipients. (I) ratio of T cells to myeloma for TIM-3+PD-1+ cells and TPEX cells (MM-controlled n = 10; MM-relapsed n = 24). Mann-Whitney t test and Pearson r correlation. (J) Fold change in myeloma cell and TIM-3+ T cell number in MM-relapsed mice relative to MM-controlled mice. Mann-Whitney t test. (K) Sort purified PD-1+TIM-3+CX3CR1− (IFNγ+ TPHEX), CX3CR1+, or PD-1− T cells were cultured with myeloma cells for 17 hours followed by Annexin V and 7AAD staining. % Killing (7AAD+) was calculated using a viability baseline from myeloma only wells. Error bars are from 3 biological replicates (PD-1− from 2 replicates) with 5 mice pooled per biological replicate. Data is mean ± SEM. Each symbol represents an individual mouse. ** p<0.01, *** p<0.001, **** p<0.0001.