
Figure 6: CD19 CAR T cells with a IFNγ + TPHEX phenotype effectively kill leukemia cells.
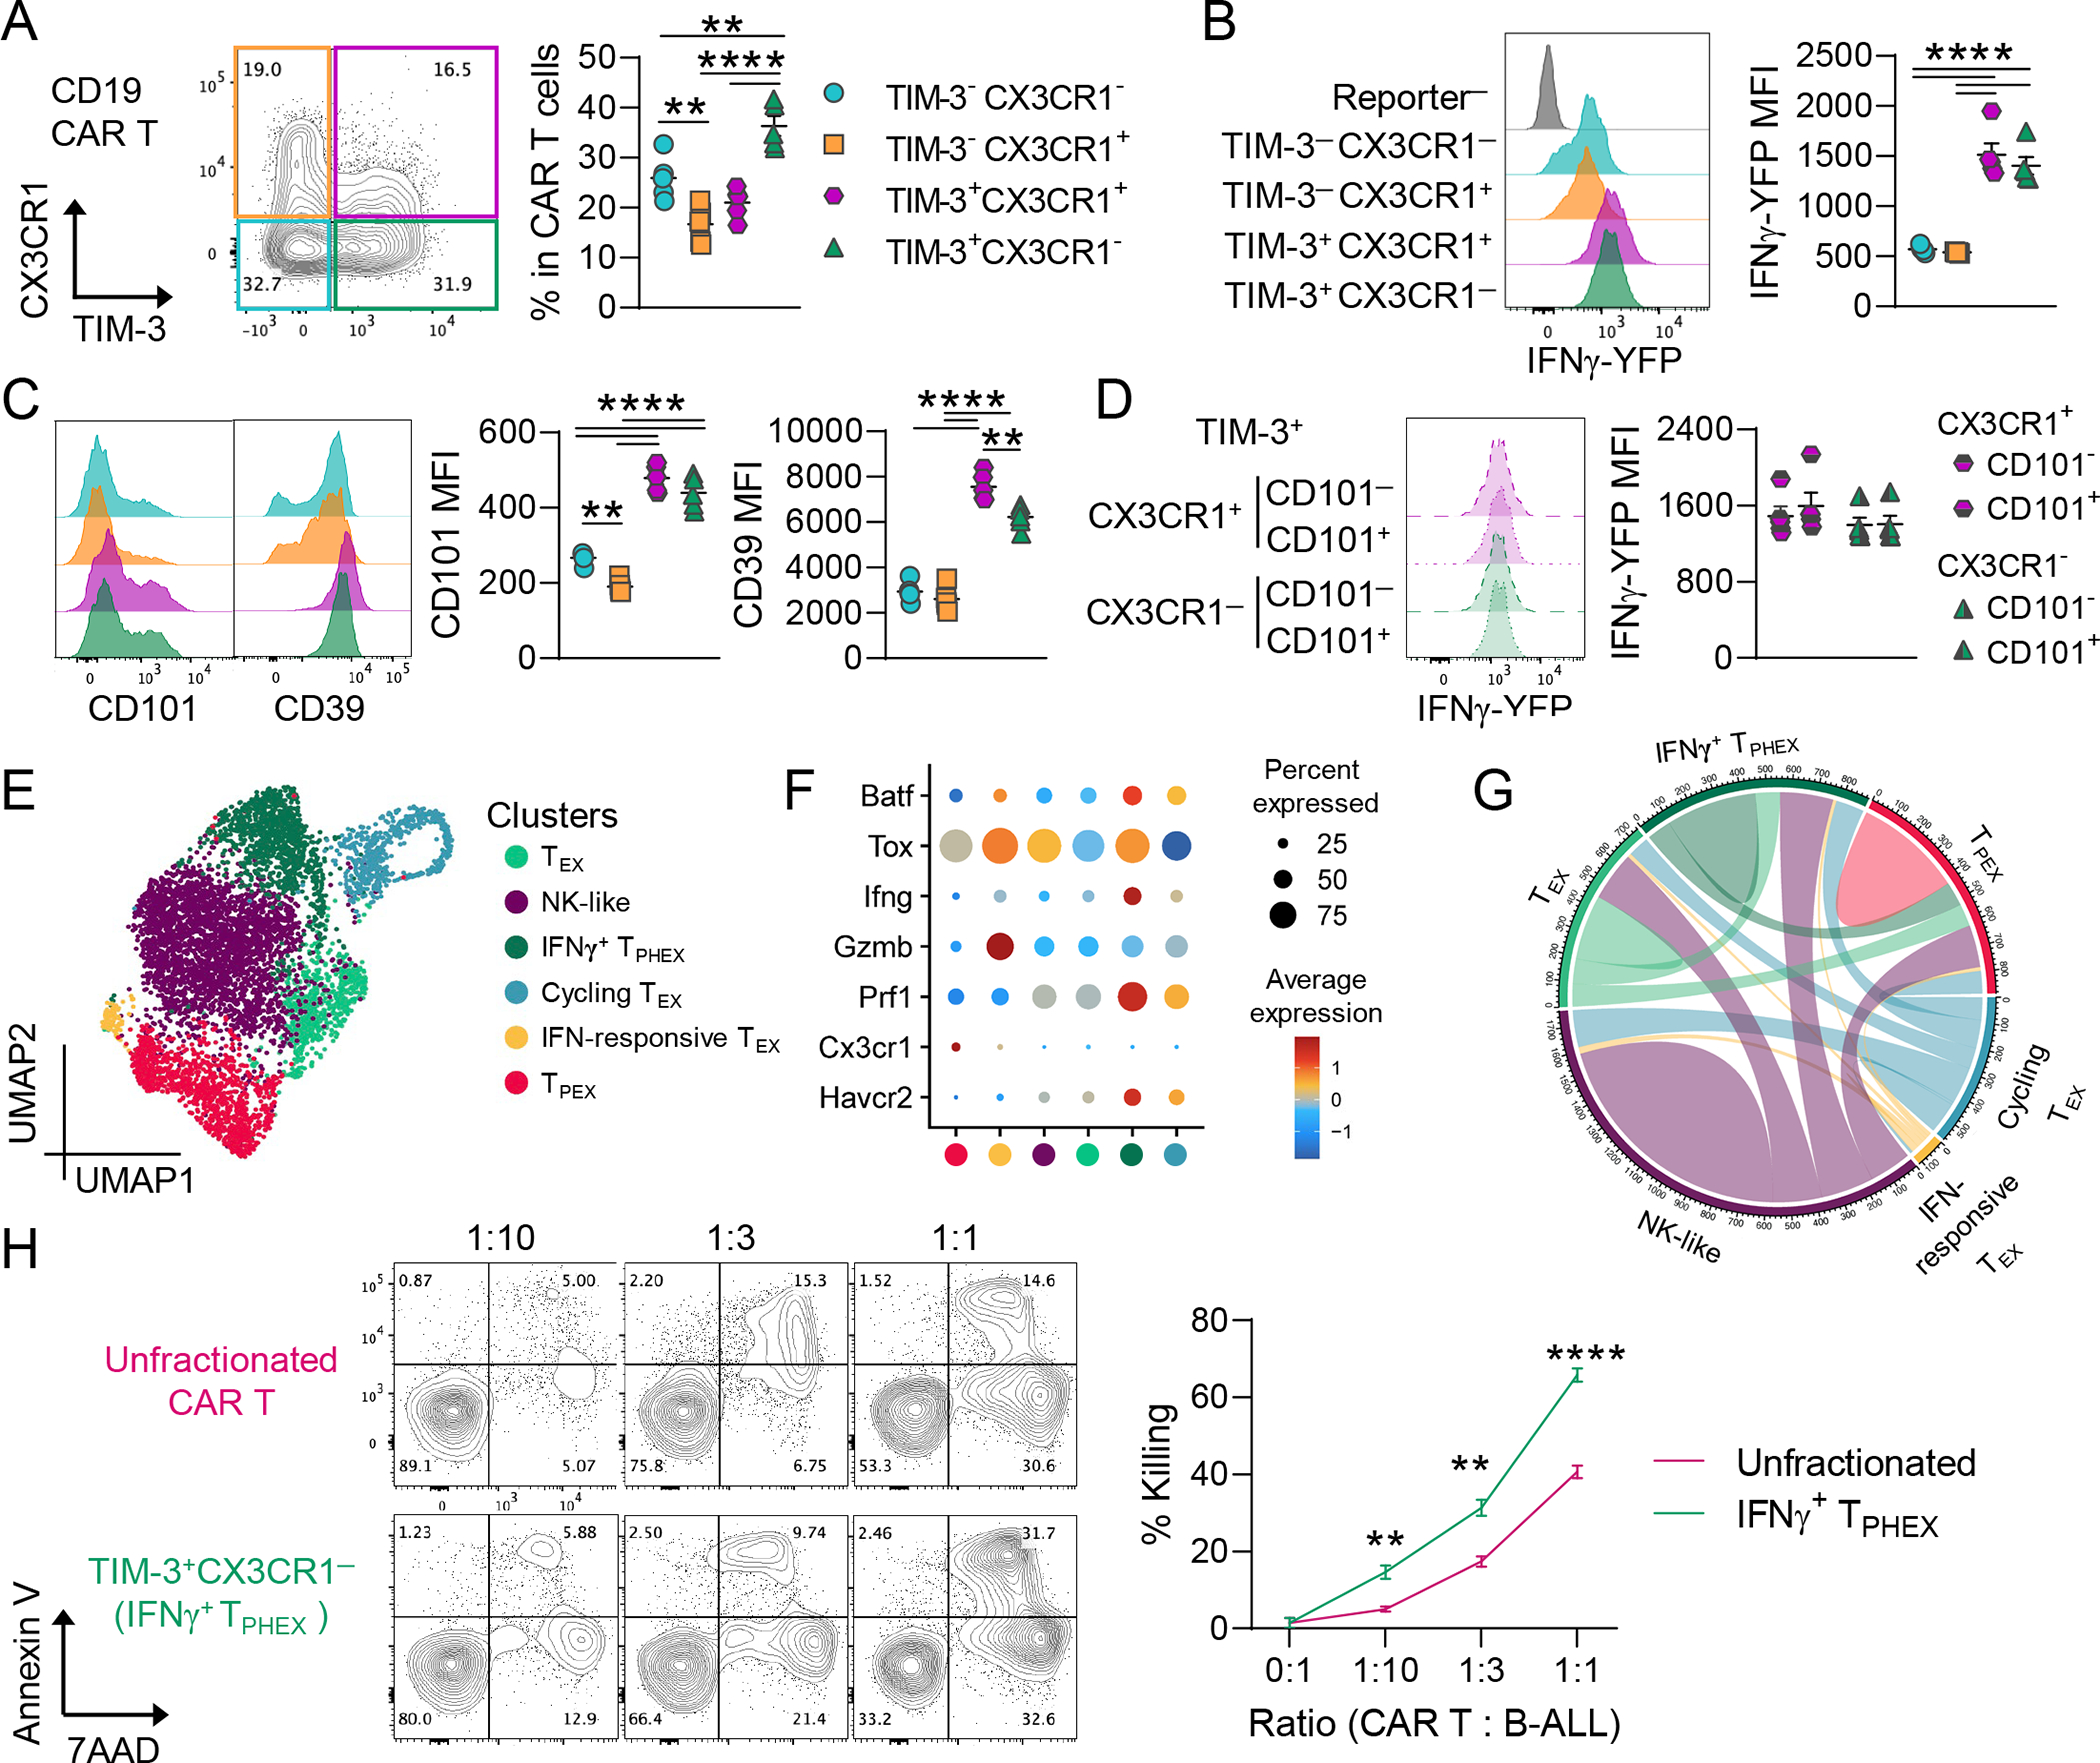
B6 mice bearing CD19+ B cell acute lymphoblastic leukemia were injected with murine CD19 CAR T cells (HULK; B6 background). CAR T cells from BM were harvested 25 days after primary transfer and were adoptively transferred to secondary B-ALL-bearing recipients. BM CAR T cells (human eGFR+) were harvested 19 days later and analyzed. (A) Representative plot of CX3CR1 and TIM-3 expression and quantification of subsets within CAR T cells. (B) Histogram of IFNγ-YFP expression (with reporter negative endogenous cells as a control) and quantification of MFI within CAR T cell subsets. (C) Histograms depicting CD101 and CD39 expression with quantification of MFI within CAR T cell subsets. (D) Histogram and quantification of IFNγ-YFP expression in TIM-3+ cells split by expression of CX3CR1 with/without CD101 co-expression. (A-D) Data is mean ± SEM. Each symbol represents an individual mouse (n = 5). One-Way ANOVA with Tukey’s test. (E-G) 5’ RNA sequencing was performed on CD8 CAR T cells. (E) UMAP embedding colored by clusters. (F) Dot plot showing gene expression within each cluster. (G) Plot depicts clonal overlap between clusters. (H) Sort purified TIM-3+ CX3CR1− CAR T cells, or unfractionated CAR T cells, were pooled from 5 biological replicates and cultured with B-ALL cells for 18 hours followed by Annexin V and 7AAD staining. Representative plots of Annexin V and 7AAD staining across effector:target ratios. The % killing was calculated using a viability baseline from B-ALL only wells (>90%). Data is mean ± SEM and error bars are from technical replicates (n = 3–5 per condition). Student’s T-test. ** p<0.01, **** p<0.0001.