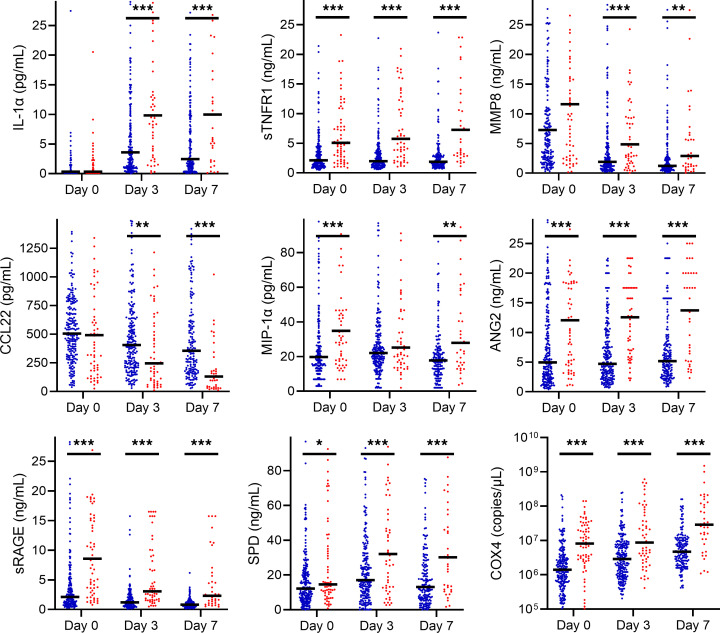
Figure 6. Unadjusted plasma biomarker levels between survivors (blue) and nonsurvivors (red) on days 0, 3, and 7 of ARDS.
Black bars are median values. Unadjusted Wilcoxon’s rank sum tests compare survivors and nonsurvivors on days 0, 3, and 7 (*P < 0.05, **P < 0.01, ***P < 0.001). Select biomarkers are shown, with the remainder in Supplemental Figure 4.

