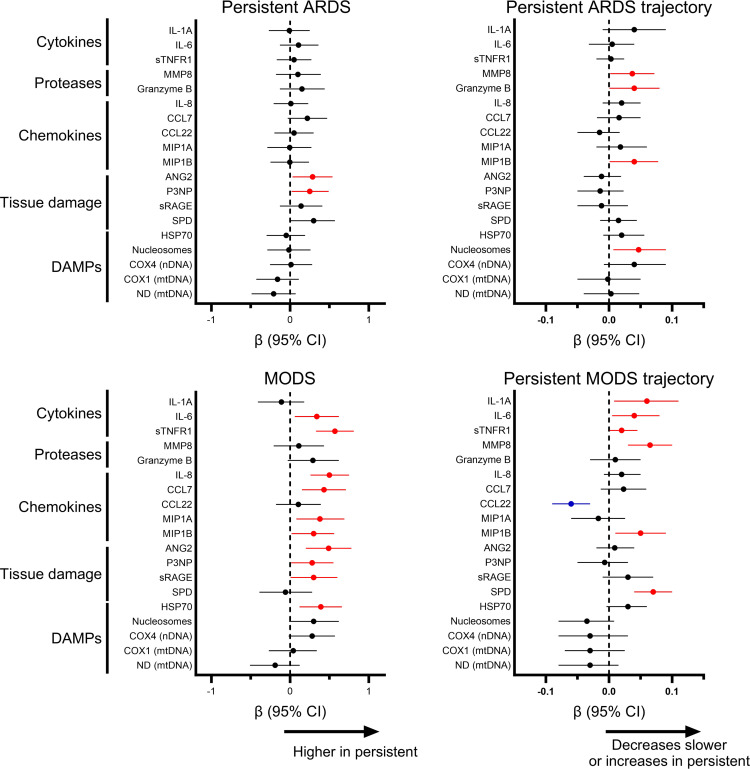
Figure 7. Association between biomarker levels and trajectory over the first 7 days of ARDS, with persistent ARDS (PaO2/FIO2 ≤ 200 on day 7) or persistent MODS (at least 2 nonpulmonary organ failures on day 7) restricted to patients who remained in the PICU until day 7 (n = 207).
The β coefficients (and 95% CIs) are plotted for the association between the overall biomarker level in the first 7 days of ARDS and the trajectory with persistent ARDS and persistent MODS. Biomarker levels are log transformed and standardized (set to mean = 0, SD = 1), and then adjusted for age, ARDS etiology, immunocompromised status, and initial PaO2/FIO2 in a multivariable mixed effects model. Red dots represent biomarkers with adjusted P < 0.05 with higher levels in nonsurvivors, blue dots represent biomarkers with adjusted P < 0.05 with lower levels in nonsurvivors, and black dots represent those with P > 0.05.

