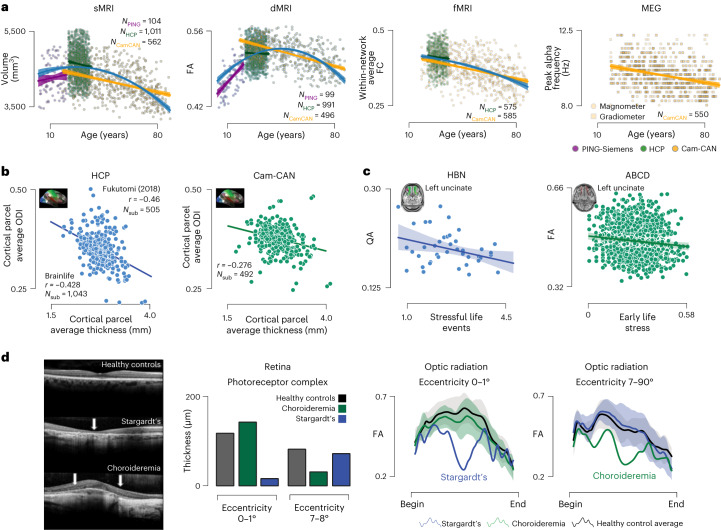
Fig. 2. brainlife.io supports scientific discovery and replication.
a–d, Identifying unique relationships with brain features over the lifespan. a, Relationship between participant age and right hippocampal volume, right inferior longitudinal fasciculus (FA, within-network average functional connectivity (FC) derived using the Yeo17 atlas and peak frequency in the alpha band derived from magnetometer (squares) and gradiometers (circles) from MEG data. These analyses include participants from the PING (purple), HCP1200 (green) and Cam-CAN (yellow) datasets. Linear regressions were fitted to each dataset, and a quadratic regression was fitted to the entire dataset (blue). b,c, Replication and generalization of previously reported scientific findings. b, Average cortical hcp-mmp parcel thickness (Nstruc = 322) compared to parcel the ODI from the NODDI model mapped to the cortical surface (inset) of the HCPS1200 dataset (Nsub = 1,043) and Cam-CAN (Nsub = 492) dataset compared to the parcel-average cortical thickness. c, Stressful life events were obtained from the NLES survey from HBN participants (Nsub = 42) compared to uncinate-average normalized quantitative anisotropy (QA). Mean linear regression (blue line) fits and standard deviation (shaded blue). Early life stress was obtained from multiple surveys collected from ABCD participants (Nsub = 1,107) compared to uncinate-average FA. Linear regression (green line) fits the data with standard deviation (shaded green). d, Identification of clinical biomarkers. d, Retinal optical coherence tomography images from healthy controls (top row), patients with Stargardt’s disease (middle row) and patients with Choroideremia (bottom row). From these images, photoreceptor complex thickness was measured for each group (controls, gray; Choroideremia, green; Stargardt’s, blue) in two distinct areas of the retina: the fovea (eccentricities 0–1°) and periphery (eccentricities 7–8°). In addition, optic radiations carrying information for each retinal area were segmented and FA profiles were mapped. Average profiles with standard error (shaded regions) were computed. One participant with Stargardt and one with Choroideremia were identified each having FA profiles that deviated from healthy controls.

