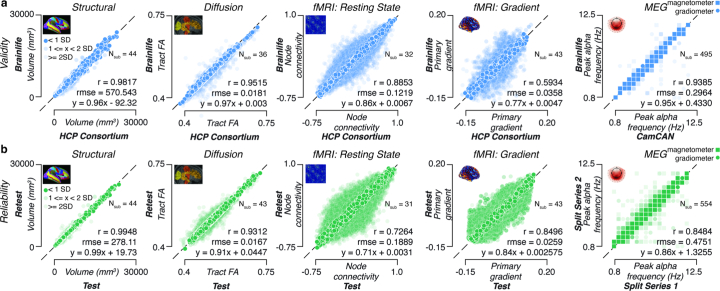
Extended Data Fig. 3. Data processing validity and reliability analysis.
Top row (a): Validity measures derived using the HCP Test-Retest (HCPTR) data. Each dot corresponds to the ratio for a given subject between data preprocessed and provided by the HCP Consortium vs data preprocessed on brainlife.io in a given measure for a given structure. Pearson’s correlation (r), root mean squared error (rmse), and a linear fit between the test and retest results were calculated. Parcel volume (mm3). Tract-average fractional anisotropy (FA). Node-wise functional connectivity (FC)*. Primary gradient value derived from resting-state fMRI*. Peak frequency (Hz) in the alpha band derived from MEG. Data from magnetometer sensors are represented as squares, and data from gradiometer sensors are represented as circles. Dark colors represent data within ±1 standard deviation (SD. 50% opacity represents data within 1-2 SD. 25% opacity represents data outside 2 SD. *A representative 5% of data presented. Bottom row (b): Test-retest reliability measures derived from derivatives of the HCPTR dataset generated using brainlife.io. Each dot corresponds to the ratio between a test-retest subject and a given measure for a given structure. Pearson’s correlation (r), root mean squared error (rmse), and a linear fit between the test and retest results were calculated.Parcel volume (mm3). Tract-average fractional anisotropy (FA). Node-wise functional connectivity (FC)*. Primary gradient value derived from resting-state fMRI*. Peak frequency (Hz) in the alpha band derived from MEG using the Cambridge (Cam-CAN) dataset. Data from magnetometer sensors are represented as squares, and data from gradiometer sensors are represented as circles. Dark colors represent data within ±1 standard deviation (SD. 50% opacity represents data within 1-2 SD. 25% opacity represents data outside 2 SD. *A representative 5% of data presented.

