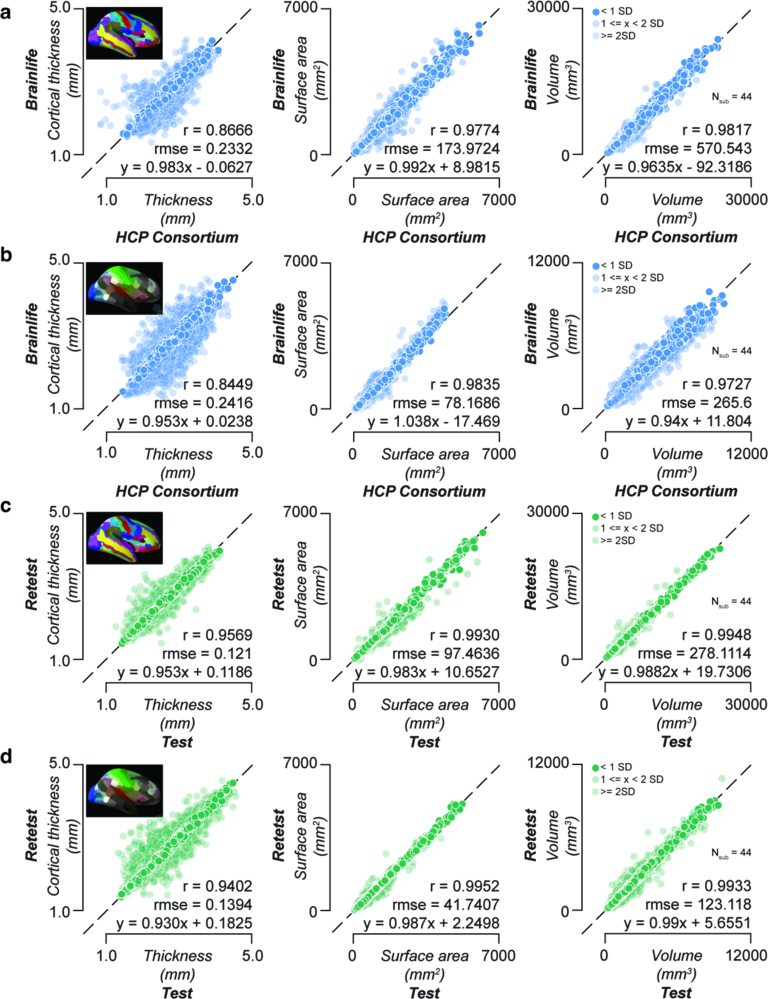
Extended Data Fig. 4. Processing with brainlife.io is valid and test-retest reliability is high - Structural MRI.
Top rows: Validity measures derived using the HCPTR data preprocessed and provided by the HCP Consortium compared to data preprocessed on brainlife.io. Each dot corresponds to the ratio for a given subject between data preprocessed and provided by the HCP Consortium vs data preprocessed on brainlife.io in a given measure for a given structure. Pearson’s correlation (r), root mean squared error (rmse), and a linear fit between the test and retest results were calculated and provided. a. Destrieux Parcel thickness (mm), surface area (mm2), and volume (mm3). b. HCP-mmp Parcel thickness (mm), surface area (mm2), and volume (mm3). Dark colors represent data within ± 1 standard deviation. 50% opacity represents data within 1-2 standard deviations. 25% opacity represents data outside 2 standard deviations. Bottom rows: Test-retest reliability measures derived from derivatives of the HCPTR dataset generated using brainlife.io. Each dot corresponds to the ratio between a test-retest subject and a given measure for a given structure. Pearson’s correlation (r), root mean squared error (rmse), and a linear fit between the test and retest results were calculated and provided. c. Destrieux Parcel thickness (mm), surface area (mm2), and volume (mm3). d. HCP-mmp Parcel thickness (mm), surface area (mm2), and volume (mm3). Dark colors represent data within ± 1 standard deviation. 50% opacity represents data within 1-2 standard deviations. 25% opacity represents data outside 2 standard deviations.

