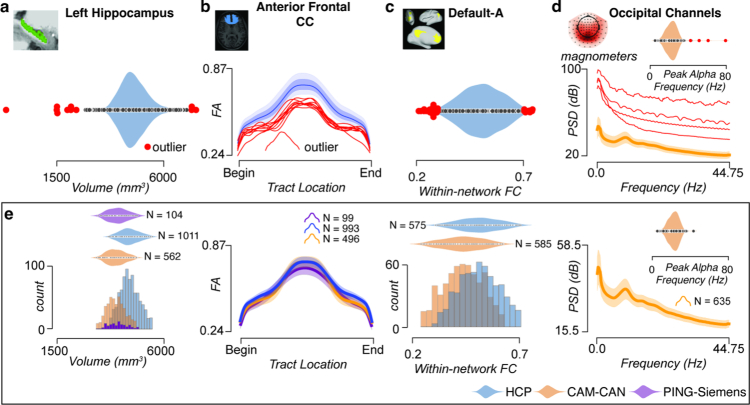
Extended Data Fig. 6. Reference datasets for quality assurance.
Example workflow for building normative reference ranges for multiple derived statistical products (cortical parcel volume, white matter tract profilometry, within-network functional connectivity, and power-spectrum density (PSD)). a. Cortical volumes of the left hippocampus from HCP participants. Red dots indicate outlier data points. b. Average fractional anisotropy (FA) profiles (blue line) plotted with two standard deviations (shaded regions). Red lines indicate outlier profiles. c. Within-network functional connectivity for the nodes within the Default-A network using the Yeo17 atlas. Red dots indicate outlier data points. d. Average PSD from occipital channels using magnetometer sensors from Cam-CAN participants with one standard deviation (shaded regions). Red lines indicate outlier participants. Peak alpha frequency distribution was also computed, and outliers were detected (inset). e. Normative reference distributions for each derived statistical product across the PING (purple), HCP (blue), and Cam-CAN (orange) datasets. These distributions have had outliers removed. An example of the brainlife.io visualization for reference datasets can be found in Fig. S5. Data are presented as mean values ± SEM.

