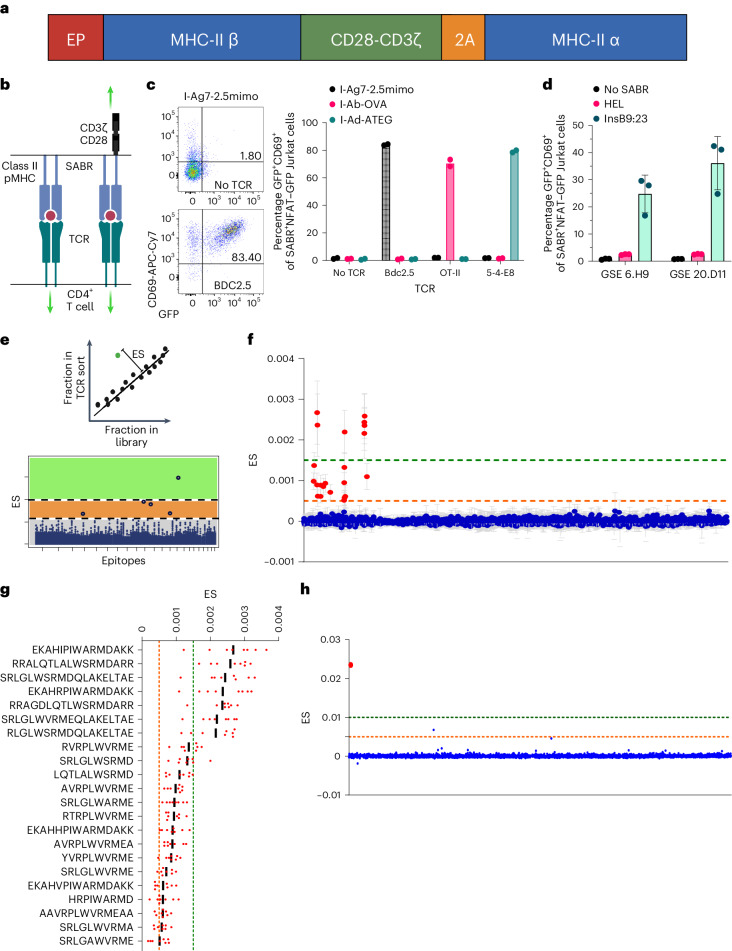
Fig. 1. SABR-IIs identify cognate TCR–pMHC interactions for antigen discovery.
a, A schematic of SABR-II constructs. b, Signaling directionality between pMHC:TCR (left) and a SABR-II:TCR (right) c, Representative and summary plots for GFP and CD69 expression from SABR-II-expressing NFAT–GFP Jurkat cells after culture with TCR-expressing Jurkat cells. The bar graph indicates the mean of two technical replicates (dots). d, SABR co-incubation of Jurkat cells expressing either the GSE.6.H9 or GSE.20.D11 TCR against NFAT–GFP Jurkat cells expressing InsB9:23 or hen egg lysozyme (HEL) in HLA-DQ8 SABR-IIs. Mean and s.d. are plotted from three biological replicates. e, Schematic (top) of the ES metric used for putative hit-calling in SABR-II screens. Cartoon ES plot (bottom) of a SABR screen where putative hits (dots/circles) will fall in high- (green) and low-confidence (orange) zones based on positive control TCR–pMHC interactions. f,g, ES plots from I-Ag7 SABR-II library screens of the BDC2.5 TCR from eight biological replicates. The green and orange lines indicate the high- and low-confidence ES zones, respectively. In f, each dot represents the mean for each epitope with s.d. In g, the bar represents the mean with each biological replicate plotted as a point for the top 22 putative hits (x axis). h, ES plot for screen of the GSE.20.D11 TCR against both HLA-A2.1 and HLA-DQ8 SABR libraries simultaneously. Reads were mapped to the DQ8 library and ES was calculated for these epitopes. The InsB9:23 epitope is highlighted by the larger red dot.

